

Question
McKee and Ptacek (2001) asked 90 college students about a time they had delivered bad news to someone. Table (see the attached) shows the results
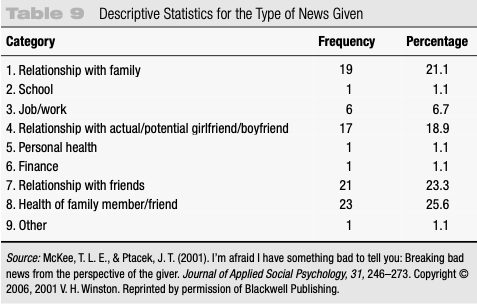
McKee and Ptacek (2001) asked 90 college students about a time they had "delivered bad news" to someone. Table (see the attached) shows the results for the type of bad news given. (a) Using this table as an example, explain the idea of a frequency table to a person who has never had a course in statistics. (b) Explain the general meaning of the pattern of results.
Step by Step Solution
There are 3 Steps involved in it
Step: 1

Get Instant Access to Expert-Tailored Solutions
See step-by-step solutions with expert insights and AI powered tools for academic success
Step: 2

Step: 3
Ace Your Homework with AI
Get the answers you need in no time with our AI-driven, step-by-step assistance
Get Started
Statistical Techniques in Business and Economics
Authors: Douglas A. Lind, William G Marchal
17th edition
1259666360, 978-1259666360