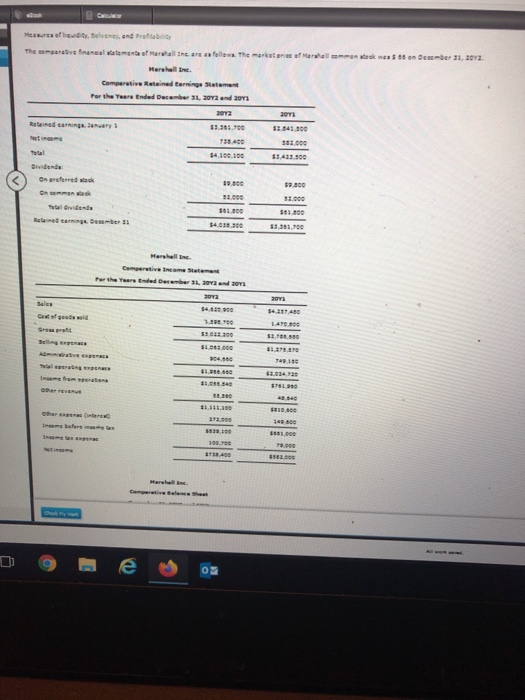
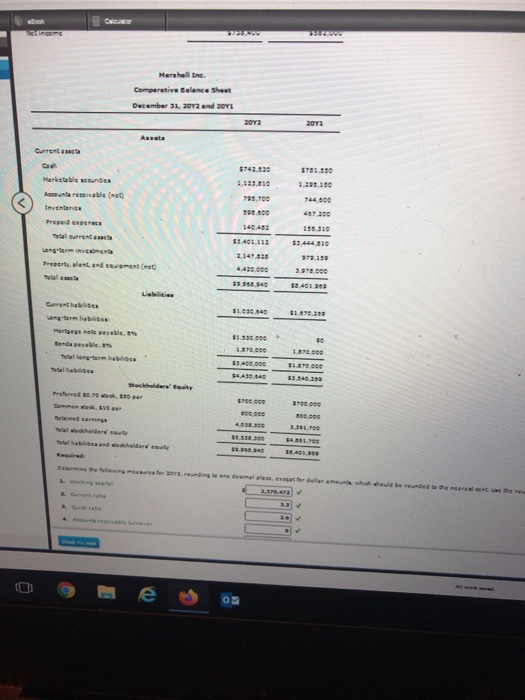
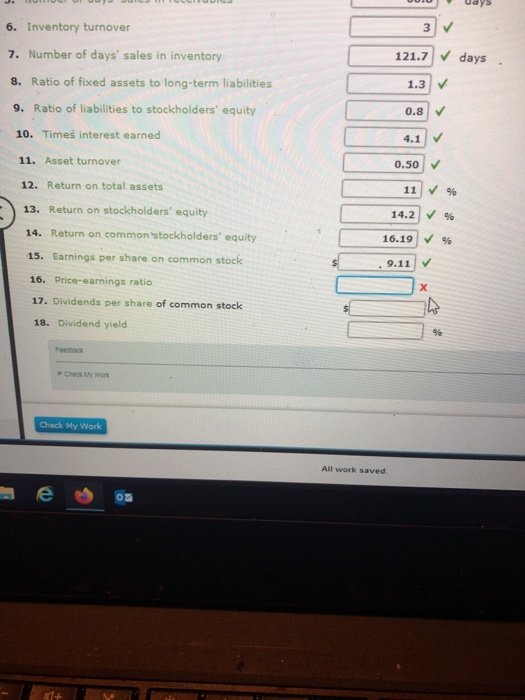
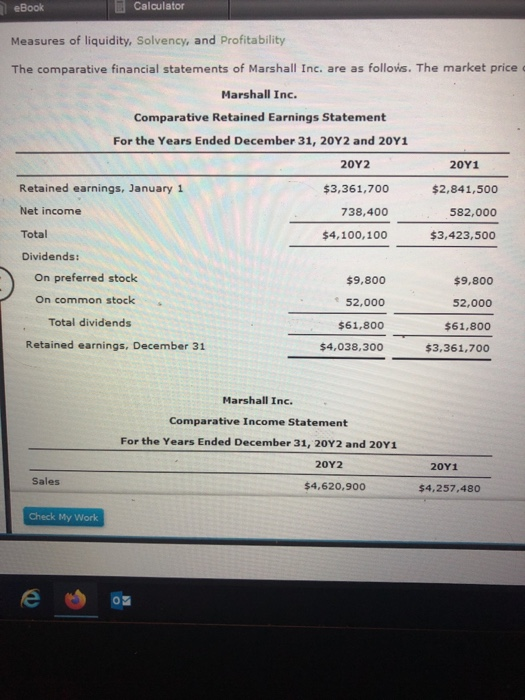
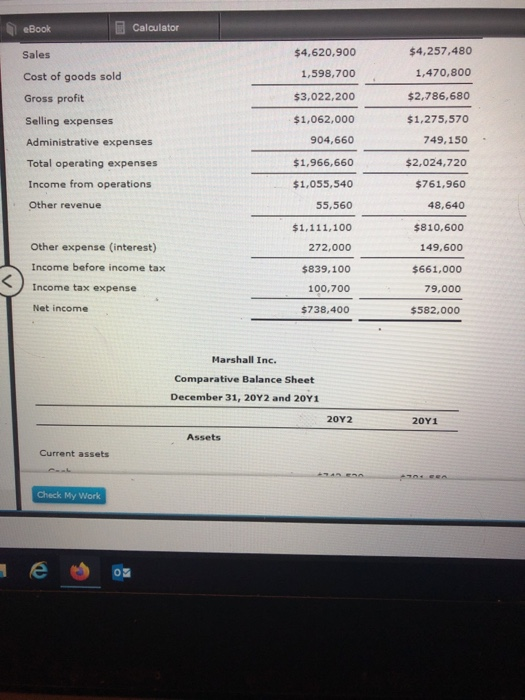
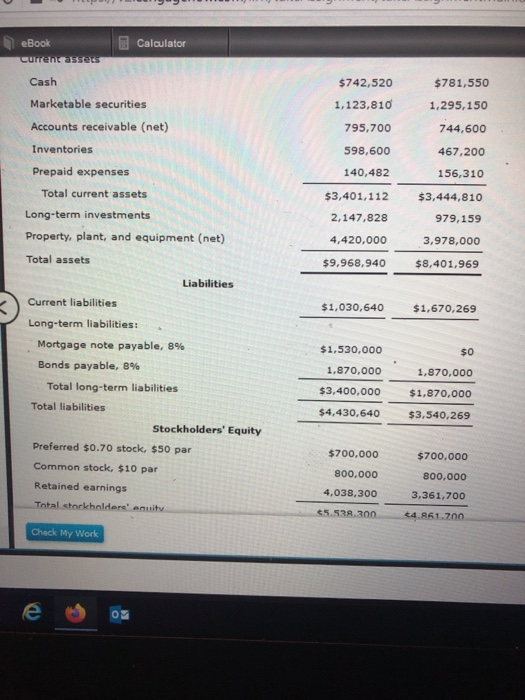
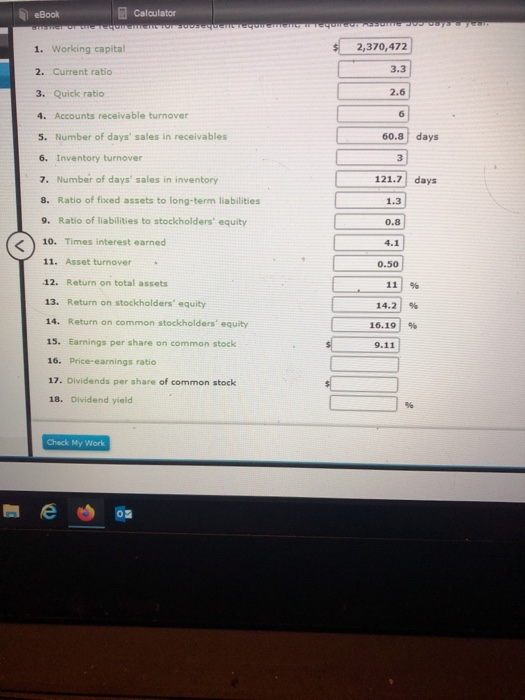
Means fly, Salves and Pro The rative financial statement of Marshall Inc. are follows. The Herehelline. Camperative Retained turning Statement For the Year Ended December 31, 2012 2013 January 53 301.00 11.541300 Retained in NE Total Devidente One On GO 53.423 900 ok 59.800 Ratan D3 Perth Yeard Dec 2012 Custofuatwold A bove Marshall Inc. Comparative Salence Sheet December 31, 2012 and 20: 2012 2013 Current $742.520 1,125,310 793.700 Marketable sunt Antarvable ( Inventaris Prep Totale 190.000 140 452 Perlant and Curretha 31..ce Stockholder Prek, COP 900. Law Inventory turnover 121.7 days. 7. Number of days' sales in inventory 8. Ratio of fixed assets to long-term liabilities 9. Ratio of liabilities to stockholders' equity 10. Times interest earned 0.50 11. Asset turnover 11 96 12. Return on total assets 13. Return on stockholders' equity 14. Return on common stockholders' equity 14.2 % % 16.19 9.11 15. Earnings per share on common stock 16. Price-earnings ratio 17. Dividends per share of common stock 18. Dividend yield F Check My Work All work saved. e eBook Calculator Measures of liquidity, Solvency, and Profitability The comparative financial statements of Marshall Inc. are as follows. The market price 2011 Marshall Inc. Comparative Retained Earnings Statement For the Years Ended December 31, 2012 and 2041 2012 Retained earnings, January 1 $3,361,700 Net income 738,400 Total $4,100,100 Dividends: On preferred stock $9,800 On common stock 52,000 Total dividends $61,800 Retained earnings, December 31 $4,038,300 $2,841,500 582,000 $3,423,500 $9,800 52,000 $61,800 $3,361,700 Marshall Inc. Comparative Income Statement For the Years Ended December 31, 2012 and 2011 20Y2 20Y1 Sales $4,620,900 $4,257,480 Check My Work eBook Calculator Sales $4,257,480 1,470,800 Cost of goods sold Gross profit $4,620,900 1,598,700 $3,022,200 $1,062,000 904,660 $2,786,680 Selling expenses $1,275,570 749,150 Administrative expenses Total operating expenses $1,966,660 $2,024,720 Income from operations $761,960 $1,055,540 55,560 Other revenue 48,640 $1,111,100 272,000 $810,600 149,600 Other expense (interest) Income before income tax $839,100 100,700 $738,400 $661,000 79,000 Income tax expense Net income $582,000 Marshall Inc. Comparative Balance Sheet December 31, 20Y2 and 2041 2012 20Y1 Assets Current assets Check My Work Calculator eBook Current assets $742,520 $781,550 1,295,150 Cash Marketable securities Accounts receivable (net) Inventories 1,123,810 795,700 598,600 744,600 467,200 156,310 140,482 Prepaid expenses Total current assets Long-term investments Property, plant, and equipment (net) Total assets $3,401,112 2,147,828 $3,444,810 979,159 3,978,000 $8,401,969 4,420,000 $9,968,940 Liabilities Current liabilities Long-term liabilities: $1,030,640 $1,670,269 Mortgage note payable, 8% Bonds payable, 8% $o $1,530,000 1,870,000 1,870,000 $3,400,000 Total long-term liabilities Total liabilities $1,870,000 $3,540,269 $4,430,640 Stockholders' Equity Preferred $0.70 stock, $50 par Common stock, $10 par Retained earnings Total stockholders' equity $700,000 800,000 4,038,300 $5.538.300 $700,000 800,000 3,361,700 *4.861.700 Check My Work eBook Calculator OUTORISEERIDO 1. Working capital 2,370,472 2. Current ratio 3. Quick ratio 3.3 4. Accounts receivable turnover 5. Number of days' sales in receivables 60.8 days 6. Inventory turnover 121.7 days 7. Number of days' sales in inventory 8. Ratio of fixed assets to long-term liabilities 0.8 9. Ratio of liabilities to stockholders' equity 10. Times interest earned 0.50 11. Asset turnover 12. Return on total assets 13. Return on stockholders' equity 14. Return on common stockholders' equity 15. Earnings per share on common stock 16. Price-earnings ratio 17. Dividends per share of common stock 18. Dividend yield Check My Work 4 . OF
