

Question
Measured data pump 2: dS = 50 mm; dD= 32 mm; z= 0.21 m (z = height difference between the pressure transducers) pi (rel.) =
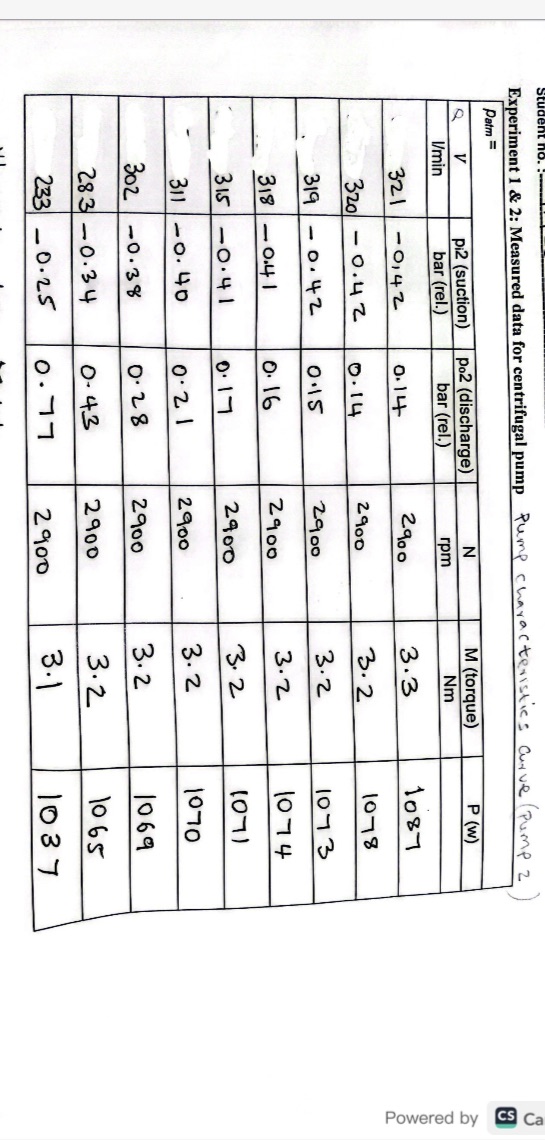
Measured data pump 2: dS = 50 mm; dD= 32 mm; z= 0.21 m (z = height difference between the pressure transducers) pi (rel.) = pin (abs.) - patm=970mbar
Calculate the head and the pump efficiency for the points and plot the pump characteristic curve
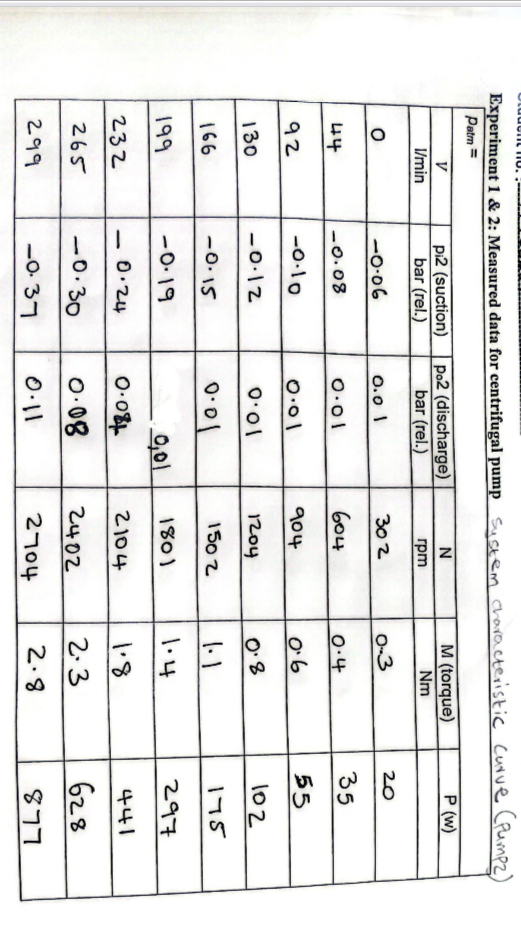
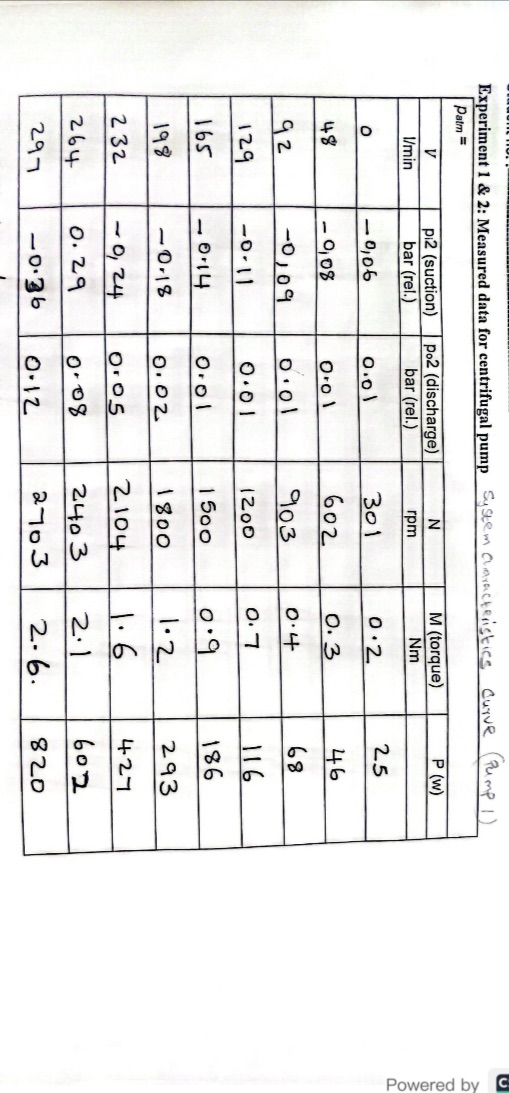
Determining the head for the pump characteristic curve and plot the system and pump characteristic curve
Develop a theoretical pump characteristic curve for the pumps in series and compare the experimental and theoretical pump characteristic curves. Determine the total head of the pumps connected in series and compare with that of a single pump. On the same axis: plot the substitute pump characteristic curve for series connection and the pump characteristic curve for one pump. What effect does a series connection have? Plot the system characteristic curve against the pump characteristic curve and discuss your observations i.e. the operating point.
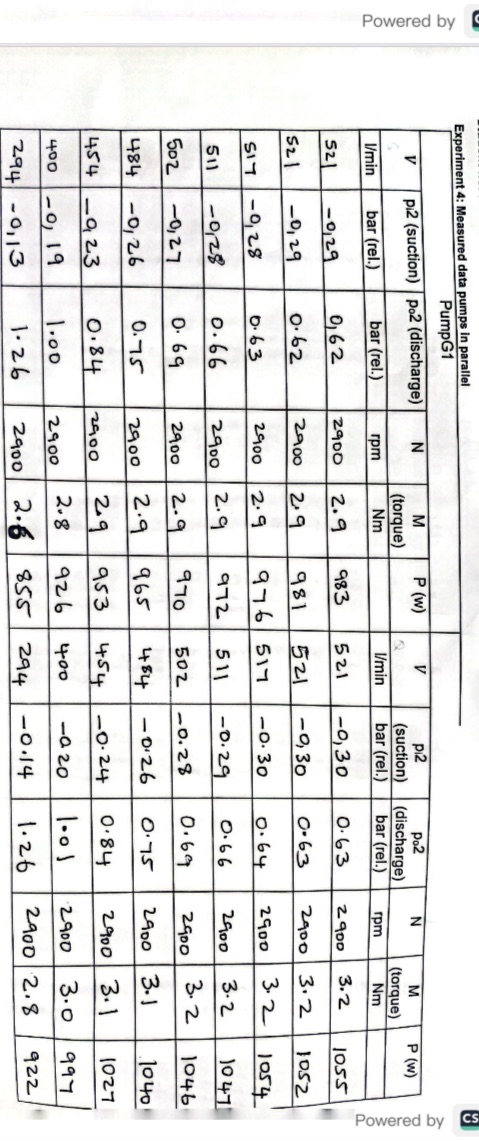
Determine the substitute head if the pumps connected in parallel are considered as a single pump:
Develop a theoretical pump characteristic curve for the pumps in parallel and compare the experimental and theoretical pump characteristic curves. On the same axis: plot the substitute pump characteristic curve for the parallel connection and the pump characteristic curve for one pump. What effect does a parallel connection have? Plot the system characteristic curve against the pump characteristic curve and discuss your observations i.e. the operating point. Compare the experimental and theoretical pump characteristic curves for pumps in series and pumps in parallel. What is the percentage error?
Discuss your observations and give reasons for any differences between your predicted values and experimental values of the pump characteristic curves for pumps in series and parallel. Explain the trend observed relative to theoretical pump knowledge.
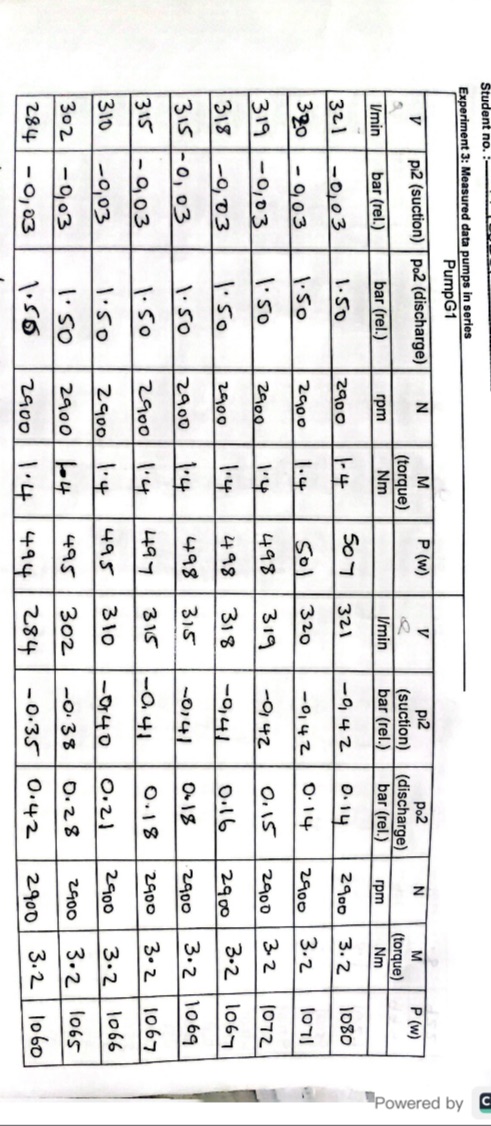
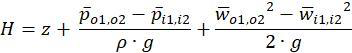
Experiment 1 \& 2: Measured data for centrifugal pump Pump characteristic: curve (pump 2 ) Experiment 1 \& 2: Measured data for centrifugal pump system characteristic curve (Pump2) Experiment 4: Measured data pumps in parallel Experiment 3: Measured data pumps in series PumpG1 \begin{tabular}{|c|c|c|c|c|c|c|c|c|c|c|c|} \hline \multicolumn{9}{|c|}{} & \multicolumn{1}{|c|}{} & \multicolumn{1}{|c|}{} \\ \hline \end{tabular} H=z+gpo1,o2pi1,i2+2gwo1,o22wi1,i22Step by Step Solution
There are 3 Steps involved in it
Step: 1

Get Instant Access to Expert-Tailored Solutions
See step-by-step solutions with expert insights and AI powered tools for academic success
Step: 2

Step: 3
Ace Your Homework with AI
Get the answers you need in no time with our AI-driven, step-by-step assistance
Get Started
Surfactant Enhanced Subsurface Remediation Emerging Technologies
Authors: David A. Sabatini, Robert C. Knox, Jeffrey H. Harwell
1st Edition
0841232253, 978-0841232259