

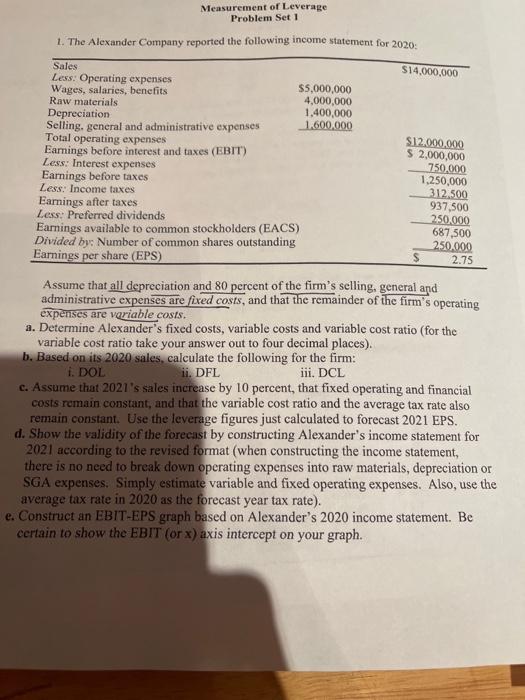
Measurement of Leverage Problem Set 1. The Alexander Company reported the following income statement for 2020: $14,000,000 Sales Less: Operating expenses Wages, salaries, benefits $5,000,000
Step by Step Solution
There are 3 Steps involved in it
Step: 1

Get step-by-step solutions from verified subject matter experts
100% Satisfaction Guaranteed-or Get a Refund!
Step: 2Unlock detailed examples and clear explanations to master concepts

Step: 3Unlock to practice, ask and learn with real-world examples
See step-by-step solutions with expert insights and AI powered tools for academic success
-
 Access 30 Million+ textbook solutions.
-
Ask unlimited questions from AI Tutors.
-
Order free textbooks.
-
100% Satisfaction Guaranteed-or Get a Refund!
Claim Your Hoodie Now!

Authors: Wolfgang Breuer, Claudia Nadler
2012th Edition
3834934496, 978-3834934499

Study Smart with AI Flashcards
Access a vast library of flashcards, create your own, and experience a game-changing transformation in how you learn and retain knowledge
Explore Flashcards

