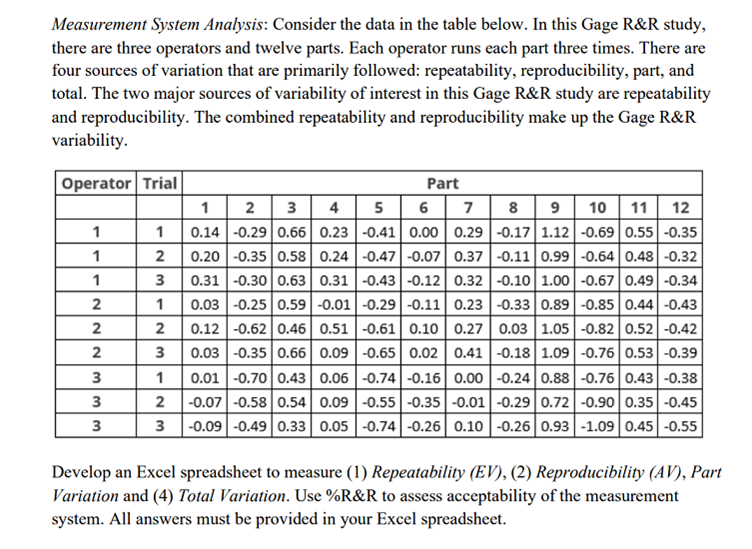
Measurement System Analysis: Consider the data in the table below. In this Gage R&R study, there are three operators and twelve parts. Each operator runs each part three times. There are four sources of variation that are primarily followed: repeatability, reproducibility, part, and total. The two major sources of variability of interest in this Gage R&R study are repeatability and reproducibility. The combined repeatability and reproducibility make up the Gage R&R variability.
Develop an Excel spreadsheet to measure (1) Repeatability (EV), (2) Reproducibility (AV), Part Variation and (4) Total Variation. Use %R&R to assess acceptability of the measurement system. All answers must be provided in your Excel spreadsheet

Measurement System Analysis: Consider the data in the table below. In this Gage R&R study, there are three operators and twelve parts. Each operator runs each part three times. There are four sources of variation that are primarily followed: repeatability, reproducibility, part, and total. The two major sources of variability of interest in this Gage R&R study are repeatability and reproducibility. The combined repeatability and reproducibility make up the Gage R&R variability. Operator Trial 8 1 1 1 . wwNNN Part 1 2 3 4 5 6 7 8 9 10 11 12 0.14 -0.29 0.66 0.23 -0.41 0.00 0.29 -0.171.12 -0.69 0.55 -0.35 0.20 -0.35 0.58 0.24 -0.47 -0.07 0.37 -0.11 0.99 -0.64 0.48 -0.32 0.31 -0.30 0.63 0.31 -0.43 -0.12 0.32 -0.101.00 -0.67 0.49 -0.34 0.03 -0.25 0.59-0.01 -0.29 -0.11 0.23 -0.33 0.89 -0.85 0.44 -0.43 0.12 -0.62 0.46 0.51 -0.61 0.10 0.27 0.03 1.05 -0.82 0.52 -0.42 0.03 -0.35 0.66 0.09 -0.65 0.02 0.41 -0.18 1.09 -0.76 0.53 -0.39 0.01 -0.70 0.43 0.06 -0.74 -0.160.00 -0.24 0.88 -0.76 0.43 -0.38 -0.07 -0.58 0.54 0.09 -0.55-0.35 -0.01 -0.29 0.72 -0.90 0.35 -0.45 -0.09 -0.49 0.33 0.05 -0.74 -0.26 0.10 -0.260.93 -1.09 0.45 -0.55 1 2 3 1 2 3 1 2 3 3 Develop an Excel spreadsheet to measure (1) Repeatability (EV), (2) Reproducibility (AV), Part Variation and (4) Total Variation. Use %R&R to assess acceptability of the measurement system. All answers must be provided in your Excel spreadsheet. Measurement System Analysis: Consider the data in the table below. In this Gage R&R study, there are three operators and twelve parts. Each operator runs each part three times. There are four sources of variation that are primarily followed: repeatability, reproducibility, part, and total. The two major sources of variability of interest in this Gage R&R study are repeatability and reproducibility. The combined repeatability and reproducibility make up the Gage R&R variability. Operator Trial 8 1 1 1 . wwNNN Part 1 2 3 4 5 6 7 8 9 10 11 12 0.14 -0.29 0.66 0.23 -0.41 0.00 0.29 -0.171.12 -0.69 0.55 -0.35 0.20 -0.35 0.58 0.24 -0.47 -0.07 0.37 -0.11 0.99 -0.64 0.48 -0.32 0.31 -0.30 0.63 0.31 -0.43 -0.12 0.32 -0.101.00 -0.67 0.49 -0.34 0.03 -0.25 0.59-0.01 -0.29 -0.11 0.23 -0.33 0.89 -0.85 0.44 -0.43 0.12 -0.62 0.46 0.51 -0.61 0.10 0.27 0.03 1.05 -0.82 0.52 -0.42 0.03 -0.35 0.66 0.09 -0.65 0.02 0.41 -0.18 1.09 -0.76 0.53 -0.39 0.01 -0.70 0.43 0.06 -0.74 -0.160.00 -0.24 0.88 -0.76 0.43 -0.38 -0.07 -0.58 0.54 0.09 -0.55-0.35 -0.01 -0.29 0.72 -0.90 0.35 -0.45 -0.09 -0.49 0.33 0.05 -0.74 -0.26 0.10 -0.260.93 -1.09 0.45 -0.55 1 2 3 1 2 3 1 2 3 3 Develop an Excel spreadsheet to measure (1) Repeatability (EV), (2) Reproducibility (AV), Part Variation and (4) Total Variation. Use %R&R to assess acceptability of the measurement system. All answers must be provided in your Excel spreadsheet


