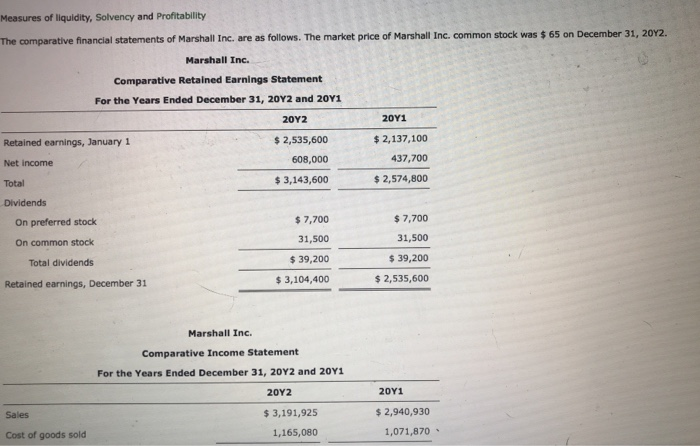
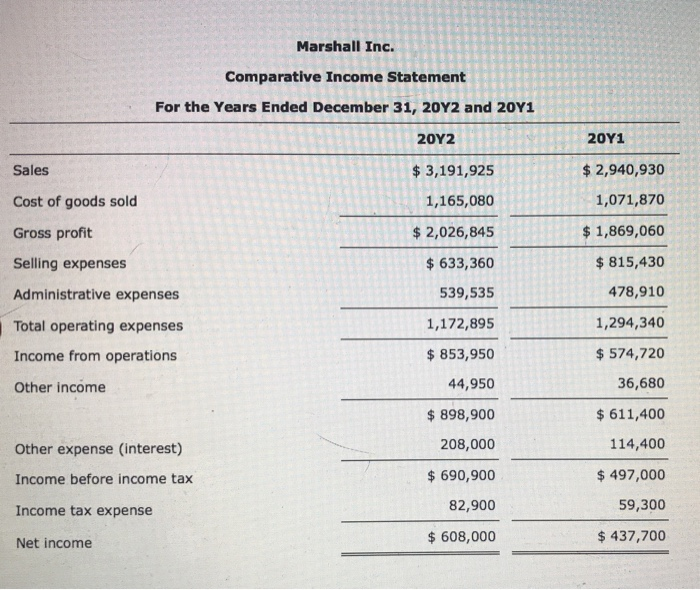
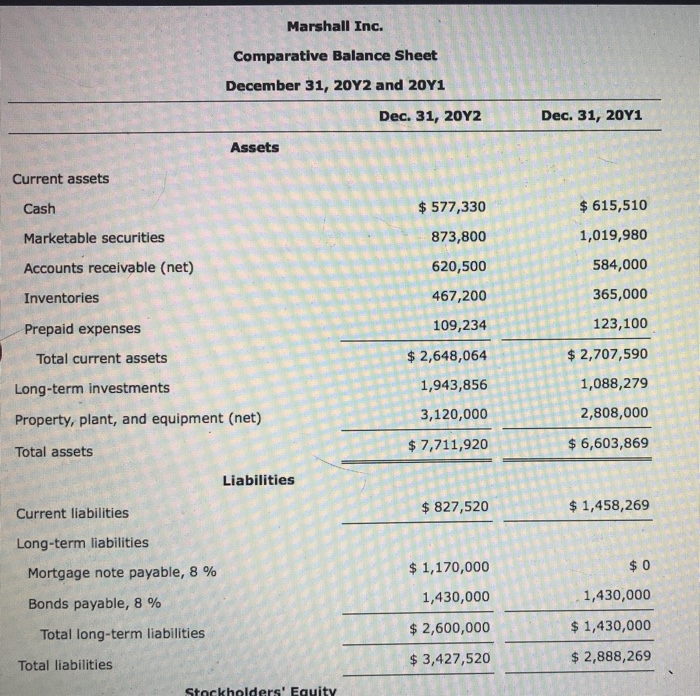
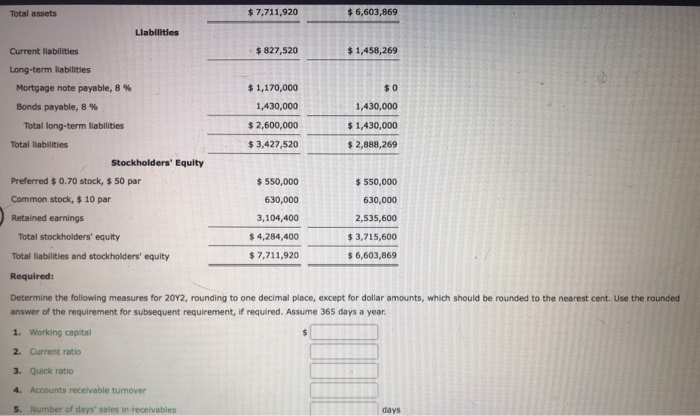
Measures of liquidity, Solvency and Profitability The comparative financial statements of Marshall Inc. are as follows. The market price of Marshall Inc, common stock was $ 65 on December 31, 2012. Marshall Inc. Comparative Retained Earnings Statement For the Years Ended December 31, 20Y2 and 2011 2012 2011 Retained earnings, January 1 $ 2,535,600 $ 2,137,100 Net Income 608,000 437,700 Total $ 3,143,600 $ 2,574,800 Dividends On preferred stock $ 7,700 $ 7,700 On common stock 31,500 31,500 Total dividends $ 39,200 $ 39,200 Retained earnings, December 31 $ 3,104,400 $ 2,535,600 Marshall Inc. Comparative Income Statement For the Years Ended December 31, 20Y2 and 2041 2012 2011 Sales $ 3,191,925 1,165,080 $ 2,940,930 1,071,870 Cost of goods sold Marshall Inc. Comparative Income Statement For the Years Ended December 31, 2012 and 2011 20Y2 20Y1 Sales $ 2,940,930 Cost of goods sold 1,071,870 Gross profit $ 1,869,060 $ 3,191,925 1,165,080 $ 2,026,845 $ 633,360 539,535 1,172,895 Selling expenses $ 815,430 Administrative expenses 478,910 Total operating expenses 1,294,340 $ 853,950 Income from operations Other income $ 574,720 36,680 44,950 $ 898,900 $ 611,400 208,000 114,400 Other expense (interest) Income before income tax $ 690,900 $ 497,000 59,300 Income tax expense 82,900 Net income $ 608,000 $ 437,700 Marshall Inc. Comparative Balance Sheet December 31, 2012 and 20Y1 Dec 31, 20Y2 Dec. 31, 20Y1 ets $ 577,330 $ 615,510 Current assets Cash Marketable securities Accounts receivable (net) Inventories 873,800 620,500 467,200 1,019,980 584,000 365,000 123,100 109,234 $ 2,648,064 $ 2,707,590 Prepaid expenses Total current assets Long-term investments Property, plant, and equipment (net) 1,943,856 1,088,279 2,808,000 3,120,000 Total assets $ 7,711,920 $ 6,603,869 Liabilities Current liabilities $ 827,520 $ 1,458,269 $ 1,170,000 $0 Long-term liabilities Mortgage note payable, 8 % Bonds payable, 8 % Total long-term liabilities Total liabilities 1,430,000 1,430,000 $ 2,600,000 $ 1,430,000 $ 3,427,520 $ 2,888,269 Stockholders' Eauitv Total assets $7,711,920 $ 6,603,869 Llabilities Current liabilities $ 827,520 $ 1,458,269 Long-term liabilities Mortgage note payable, 8 % Bonds payable, 8 % Total long-term liabilities $ 1,170,000 1,430,000 $ 2,600,000 $3,427,520 1,430,000 $ 1,430,000 $ 2,888,269 Total liabilities Stockholders' Equity Preferred $ 0.70 stock, $ 50 par Common stock, $ 10 par $ 550,000 630,000 3,104,400 Retained earnings Total stockholders' equity $ 550,000 630,000 2,535,600 $ 3,715,600 $6,603,869 $ 4,284,400 $ 7,711,920 Total liabilities and stockholders' equity Required: Determine the following measures for 2012, rounding to one decimal place, except for dollar amounts, which should be rounded to the nearest cent. Use the rounded answer of the requirement for subsequent requirement, if required. Assume 365 days a year 1. Working capital 2. Current ratio 3. Quick ratio 4. Accounts receivable turnover 5. Number of days' sales in receivables Determine the following measures for 2012, rounding to one decimal place, except for dollar amounts, which should be rounded to the nearest cent. Use the rounded answer of the requirement for subsequent requirement, if required. Assume 365 days a year. 1. Working capital 2. Current ratio 3. Quick ratio 4. Accounts receivable turnover 5. Number of days' sales in receivables days 6. Inventory turnover 7. Number of days' sales in inventory 8. Ratio of fixed assets to long-term liabilities days 9. Ratio of liabilities to stockholders' equity 10. Times interest earned 11. Asset turnover 12. Return on total assets 13. Return on stockholders' equity 14. Return on common stockholders' equity 15. Earnings per share on common stock 16. Price-earnings ratio 17. Dividends per share of common stock 18. Dividend yield