Answered step by step
Verified Expert Solution
Link Copied!

Question

1 Approved Answer

Measures of position of quartile for Grouped data Q3 = 90.5 + -- 5 = 60.5 + 1.45 Then, Q3= 91.96 Therefore, 75% of the

Measures of position of quartile for Grouped data
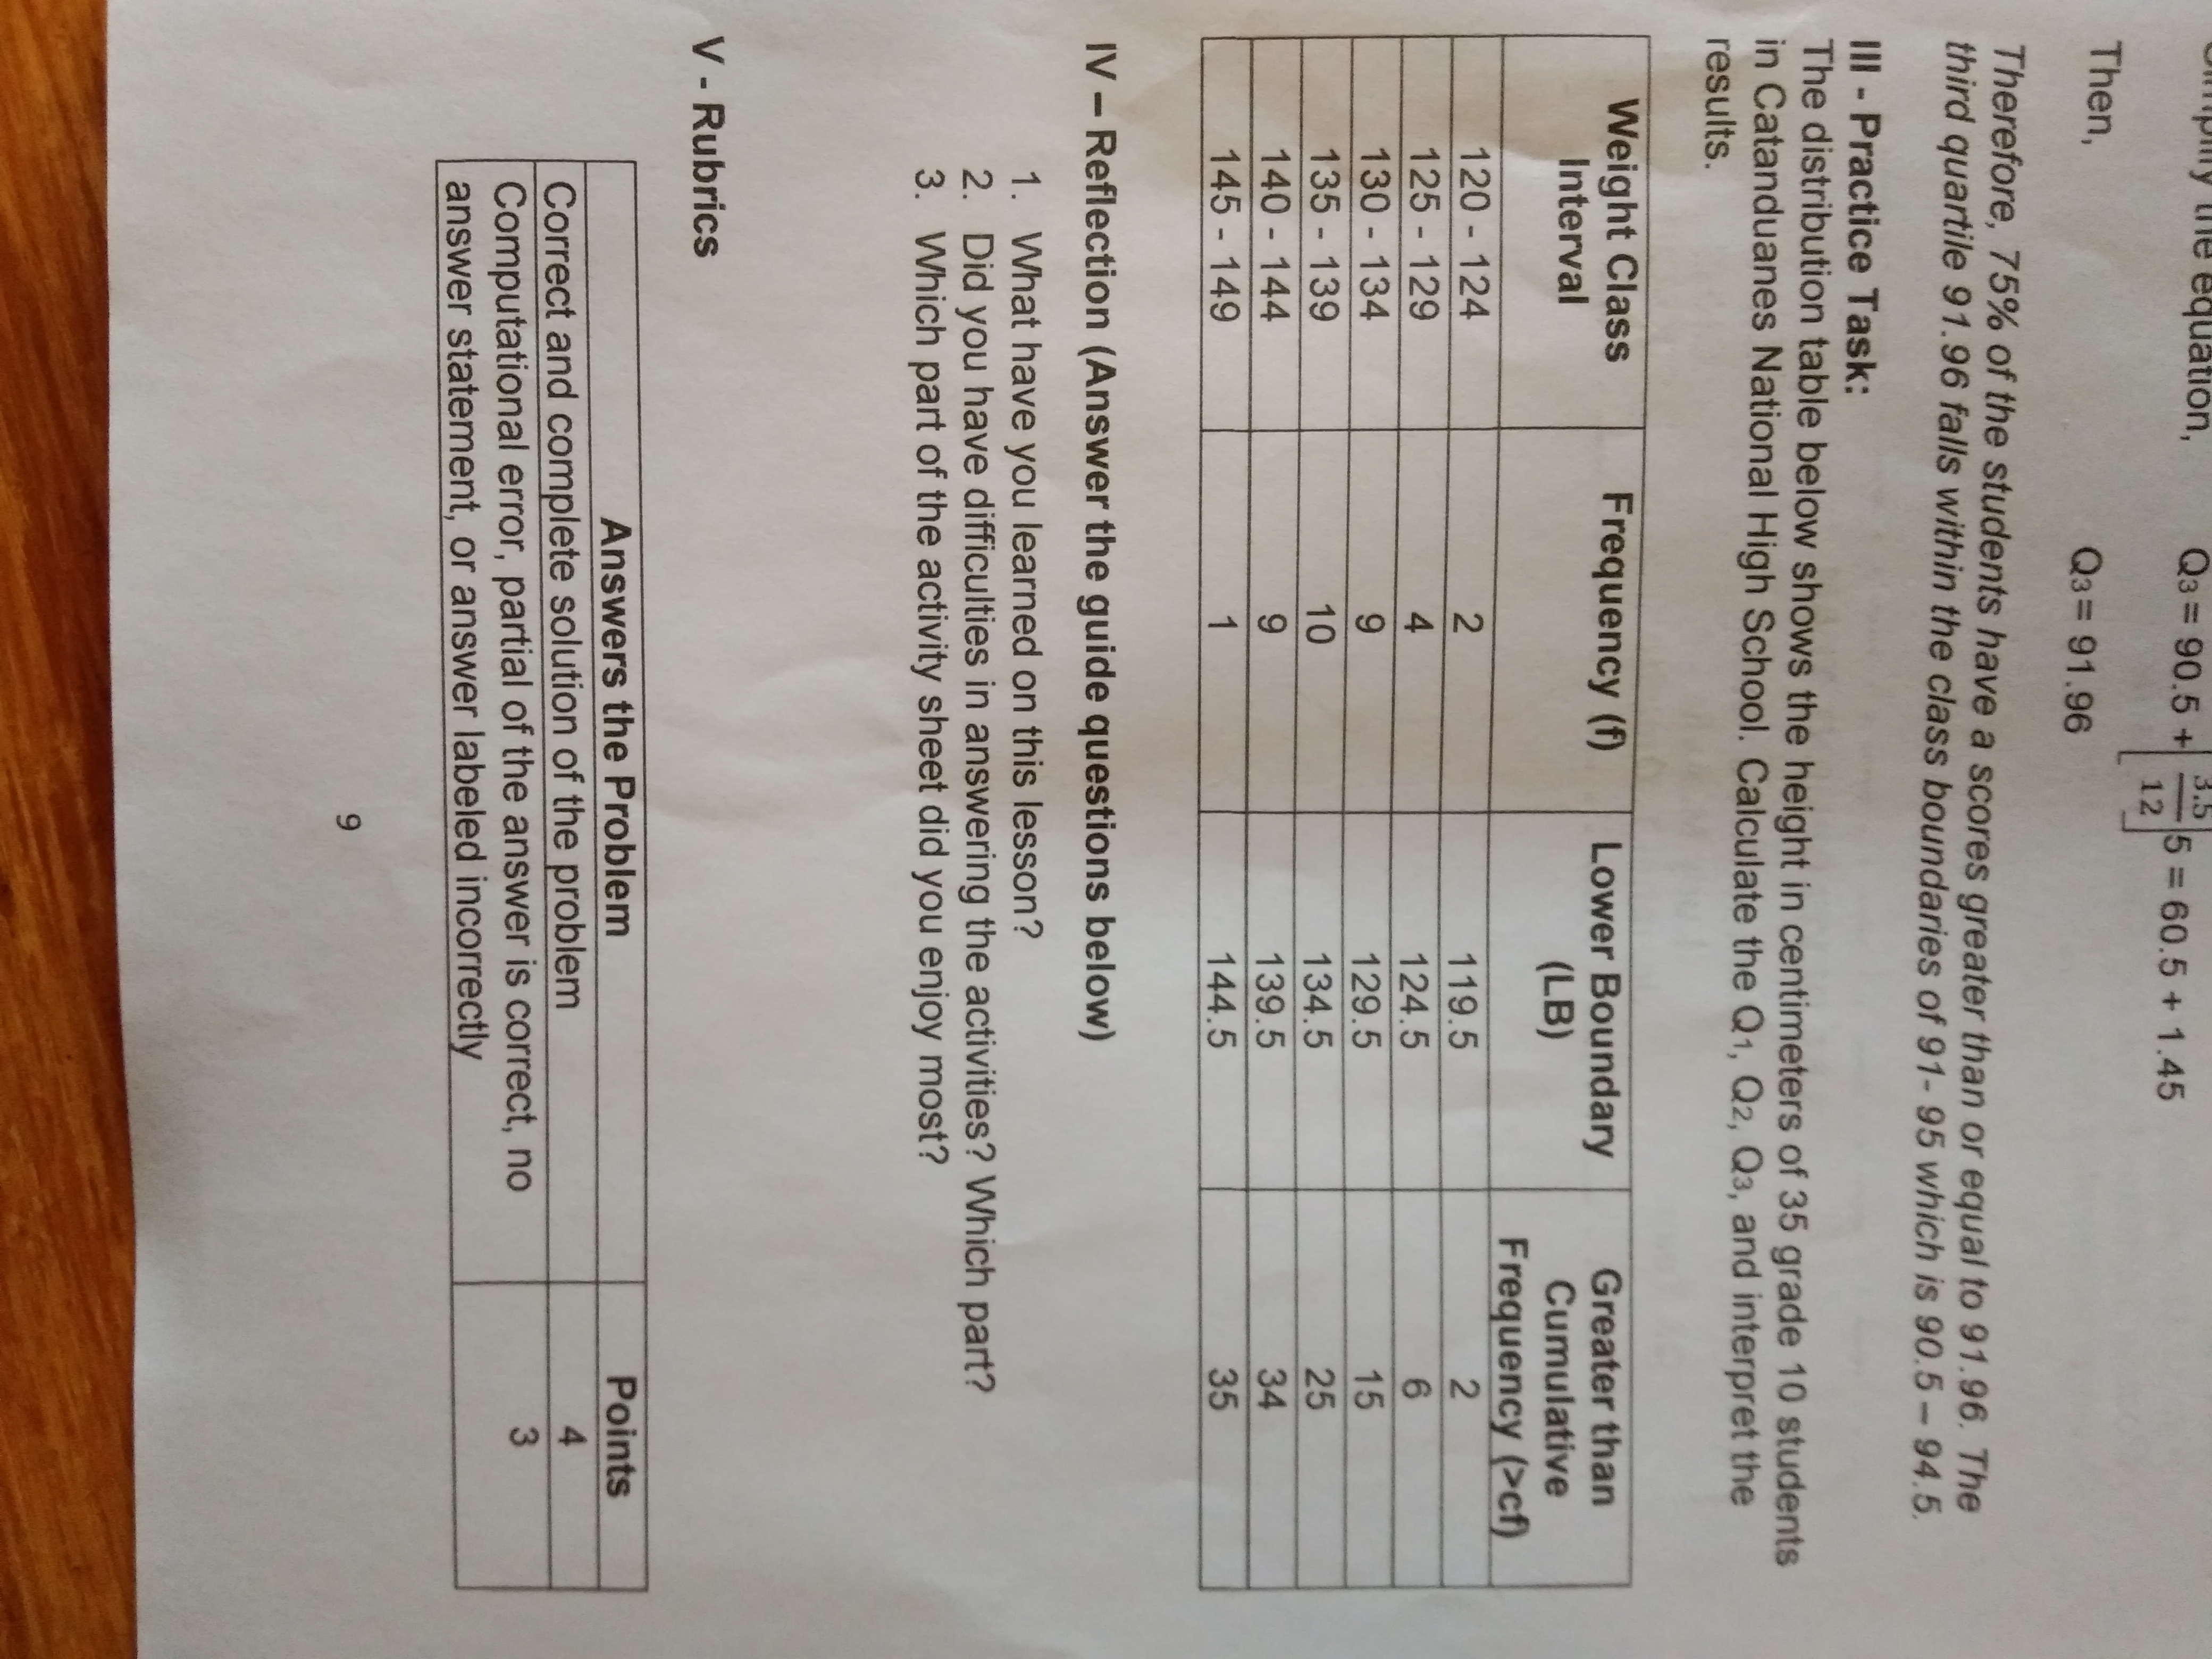
image text in transcribed
Q3 = 90.5 + -- 5 = 60.5 + 1.45 Then, Q3= 91.96 Therefore, 75% of the students have a scores greater than or equal to 91.96. The third quartile 91.96 falls within the class boundaries of 91- 95 which is 90.5 - 94.5 Ill - Practice Task: The distribution table below shows the height in centimeters of 35 grade 10 students in Catanduanes National High School. Calculate the Q1, Q2, Q3, and interpret the results. Weight Class Frequency (f) Lower Boundary Greater than Interval (LB) Cumulative Frequency (>cf) 120 - 124 119.5 125 - 129 124.5 130 - 134 129.5 135 - 139 134.5 140 - 144 139.5 145 - 149 144.5 IV - Reflection (Answer the guide questions below) 1. What have you learned on this lesson? 2. Did you have difficulties in answering the activities? Which part? 3. Which part of the activity sheet did you enjoy most? V - Rubrics Answers the Problem Points Correct and complete solution of the problem Computational error, partial of the answer is correct, no answer statement, or answer labeled incorrectly O

Step by Step Solution

There are 3 Steps involved in it

Step: 1

blur-text-image

Get Instant Access to Expert-Tailored Solutions

See step-by-step solutions with expert insights and AI powered tools for academic success

Step: 2

blur-text-image

Step: 3

blur-text-image

Ace Your Homework with AI

Get the answers you need in no time with our AI-driven, step-by-step assistance

Get Started

Recommended Textbook for

Elementary Algebra

Authors: Charles P McKeague

3rd Edition

1483263843, 9781483263847

More Books

Students also viewed these Mathematics questions