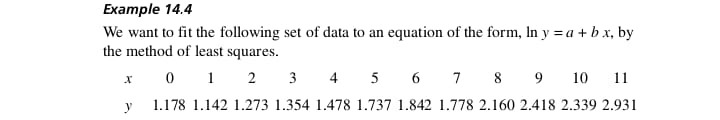
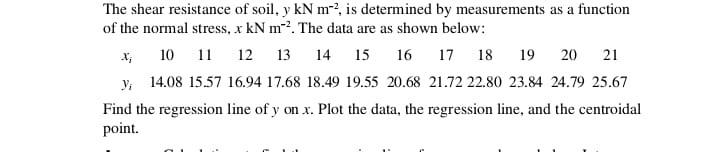
Mechanical components are being produced continuously. A quality control program for the mechanical components requires a close estimate of the proportion defective in production when all settings are correct. 1020 components are examined under these conditions, and 27 of the 1020 items are found to be defective. (a) Find a point estimate of the proportion defective. (b) Find a 95% two-sided confidence interval. (c) Find an upper limit giving 95% level of confidence that the true proportion defective is less than this limiting value. Use Excel in parts (b) and (c).In Example 4.2 and Table 4.5 we had data on the thicknesses of 121 metal parts of an optical instrument. The histogram for these data was shown in Figure 4.4, and we saw later that its shape was similar to the shape we might expect for a normal fre- quency distribution. In Example 7.9 we plotted the data on normal probability paper and found good agreement. Now we will test the data for goodness of fit to a normal distribution at 5% level of significance.Example 14.4 We want to fit the following set of data to an equation of the form, In y = a + b x, by the method of least squares. 0 1 2 4 5 6 7 8 9 10 11 y 1.178 1.142 1.273 1.354 1.478 1.737 1.842 1.778 2.160 2.418 2.339 2.931The shear resistance of soil, y kN m", is determined by measurements as a function of the normal stress, x kN m". The data are as shown below: 10 11 12 13 14 15 16 17 18 19 20 21 y; 14.08 15.57 16.94 17.68 18.49 19.55 20.68 21.72 22.80 23.84 24.79 25.67 Find the regression line of y on x. Plot the data, the regression line, and the centroidal point.For the data given in Examples 14.1 and 14.2: a) Find the 90% confidence interval for the slope of the regression line of shear resistance on normal stress. b) Is the slope significantly larger than 1.000 at the 5% level of significance? c) Find the 95% confidence interval for the mean response of shear resistance at a normal stress of 12 kN/m. d) Is the mean response for the shear resistance at a normal stress of 12 kN/m significantly more than 16.5 kN/m' at the 1% level of significance? e) Find the 95% prediction interval for a single new observation at a normal stress of 20 kN/m-= 5,025.214_ (241.80) 12 = 5,025.214 - 4,872.399 = 152.815 = 3895.587- (186) (241.80) 12 = 3895.587 - 3,747.950= 147.637 Then be 147.637 143 = 1.032 and a =y-b x =20.151-(1.032)(15.5)=4.148. Because the calculations of S,. S. . and a all involve differences of numbers of similar magnitudes, it is particularly important not to round the numbers too soon. The regression line of y on x is y =4.148 + 1.032 .x. The data, centroidal point and regression line of y on x are shown in Figure 14.8. 22 Shear Resistance, y kNan Centroidal point 17 - 20 Normal Stress, * kN/ Figure 14.8: Shear resistance of soil as a function of normal stress 356 Regression and Correlation Example 14.2 For the data of Example 14.1 calculate the standard deviation of points about the regression line, then plot residuals against the input, and comment on the results. Answer: Calculations for these plots are shown in Table 14.1. Table 14.1: Calculation of residuals X Residuals 10 14.08 14.47 -0.39 11 15.57 15.50 +0.07 12 16.94 16.54 +0.40 13 17.68 17.57 +0.11 14 18.49 18.60 -0.12 15 19.55 19.63 -0.08 16 20.68 20.67 +0.01 17 21.72 21.70 +0.02 18 22.80 22.73 +0.07 19 23.84 23.77 +0.08 20 24.79 24.80 -0.01 21 25.67 25.83 -0.16 0.4 Residual, 02. O O