Members of the Church of Jesus Christ of Latter-day Saints (LDS) historically have had relatively low levels of tobacco smoking because of the churchs health guidelines. Consequently, the burden of tobacco-related cancer has been lower in this group of people. In Utah, during 19951999, the number of smoking-related deaths was 1,184 (person-years = 3,035,897) for LDS members and 794 (person-years = 916,859) for non-LDS members.
1.How much greater is the risk of tobacco-related cancer among non-LDS members than LDS members?
2. Calculate the percent increase change of a tobacco-related cancer among non-LDS members compared with LDS members.
3. Calculate the attributable risk and interpret your result. Calculate the attributable risk percent and interpret your result.
4.Calculate the population attributable risk and interpret your result.
5. Calculate the population attributable risk percent and interpret your result.
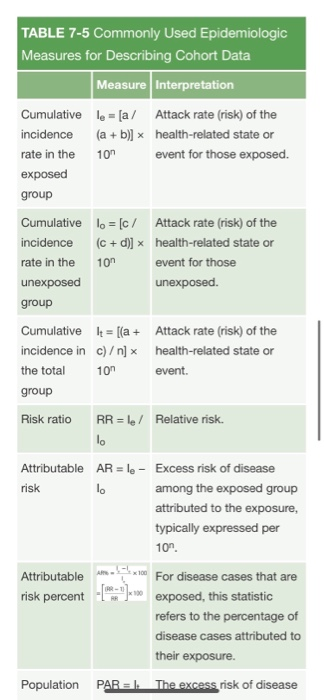
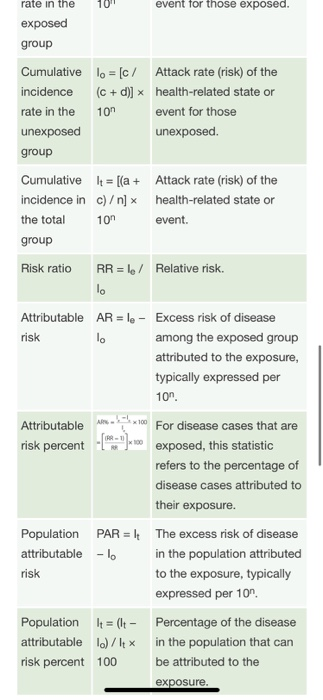
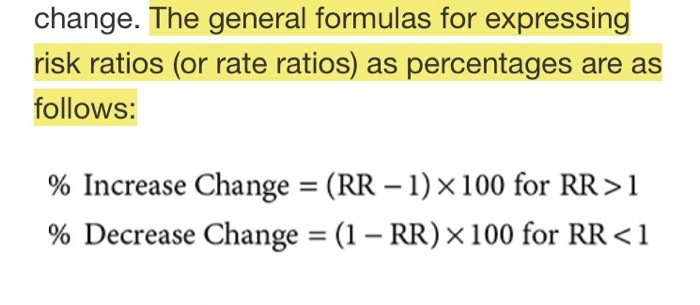
TABLE 7-5 Commonly used Epidemiologic Measures for Describing Cohort Data Measure Interpretation Cumulative le= (a/ Attack rate (risk) of the incidence (a + b)] health-related state or rate in the 10 event for those exposed. exposed group Cumulative lo = [c/ Attack rate (risk) of the incidence (c + d)] > health-related state or rate in the 101 event for those unexposed unexposed. group Cumulative It = [(a+ Attack rate (risk) of the incidence in C)] * health-related state or the total 101 event. group Risk ratio RR = 1,/ Relative risk. lo Attributable AR = 10 - Excess risk of disease risk lo among the exposed group attributed to the exposure, typically expressed per 109 Attributable risk percent For disease cases that are exposed, this statistic refers to the percentage of disease cases attributed to their exposure. Population PAREL The excess risk of disease 10 event for those exposed. rate in the exposed group 101 Cumulative lo = [c/ Attack rate (risk) of the incidence (c + d)] > health-related state or rate in the event for those unexposed unexposed group Cumulative lt = [(a+ Attack rate (risk) of the incidence in c)] * health-related state or the total 100 event. group Risk ratio RR = le / Relative risk. To Attributable AR = 10 - Excess risk of disease risk lo among the exposed group attributed to the exposure, typically expressed per 101 Attributable For disease cases that are risk percent exposed, this statistic refers to the percentage of disease cases attributed to their exposure. Population PAR =The excess risk of disease attributable - in the population attributed risk to the exposure, typically expressed per 10 Population 1 = (lt - Percentage of the disease attributable 1.) / 14 * in the population that can risk percent 100 be attributed to the exposure. change. The general formulas for expressing risk ratios (or rate ratios) as percentages are as follows: % Increase Change = (RR 1)x100 for RR>1 % Decrease Change = (1 RR) X 100 for RR health-related state or rate in the 101 event for those unexposed unexposed. group Cumulative It = [(a+ Attack rate (risk) of the incidence in C)] * health-related state or the total 101 event. group Risk ratio RR = 1,/ Relative risk. lo Attributable AR = 10 - Excess risk of disease risk lo among the exposed group attributed to the exposure, typically expressed per 109 Attributable risk percent For disease cases that are exposed, this statistic refers to the percentage of disease cases attributed to their exposure. Population PAREL The excess risk of disease 10 event for those exposed. rate in the exposed group 101 Cumulative lo = [c/ Attack rate (risk) of the incidence (c + d)] > health-related state or rate in the event for those unexposed unexposed group Cumulative lt = [(a+ Attack rate (risk) of the incidence in c)] * health-related state or the total 100 event. group Risk ratio RR = le / Relative risk. To Attributable AR = 10 - Excess risk of disease risk lo among the exposed group attributed to the exposure, typically expressed per 101 Attributable For disease cases that are risk percent exposed, this statistic refers to the percentage of disease cases attributed to their exposure. Population PAR =The excess risk of disease attributable - in the population attributed risk to the exposure, typically expressed per 10 Population 1 = (lt - Percentage of the disease attributable 1.) / 14 * in the population that can risk percent 100 be attributed to the exposure. change. The general formulas for expressing risk ratios (or rate ratios) as percentages are as follows: % Increase Change = (RR 1)x100 for RR>1 % Decrease Change = (1 RR) X 100 for RR


