Menu DS1000 - Assignment 3.p.. X + Create Sign in X All tools Edit Convert E-Sign Find text or tools Q Al Assistant Part 1
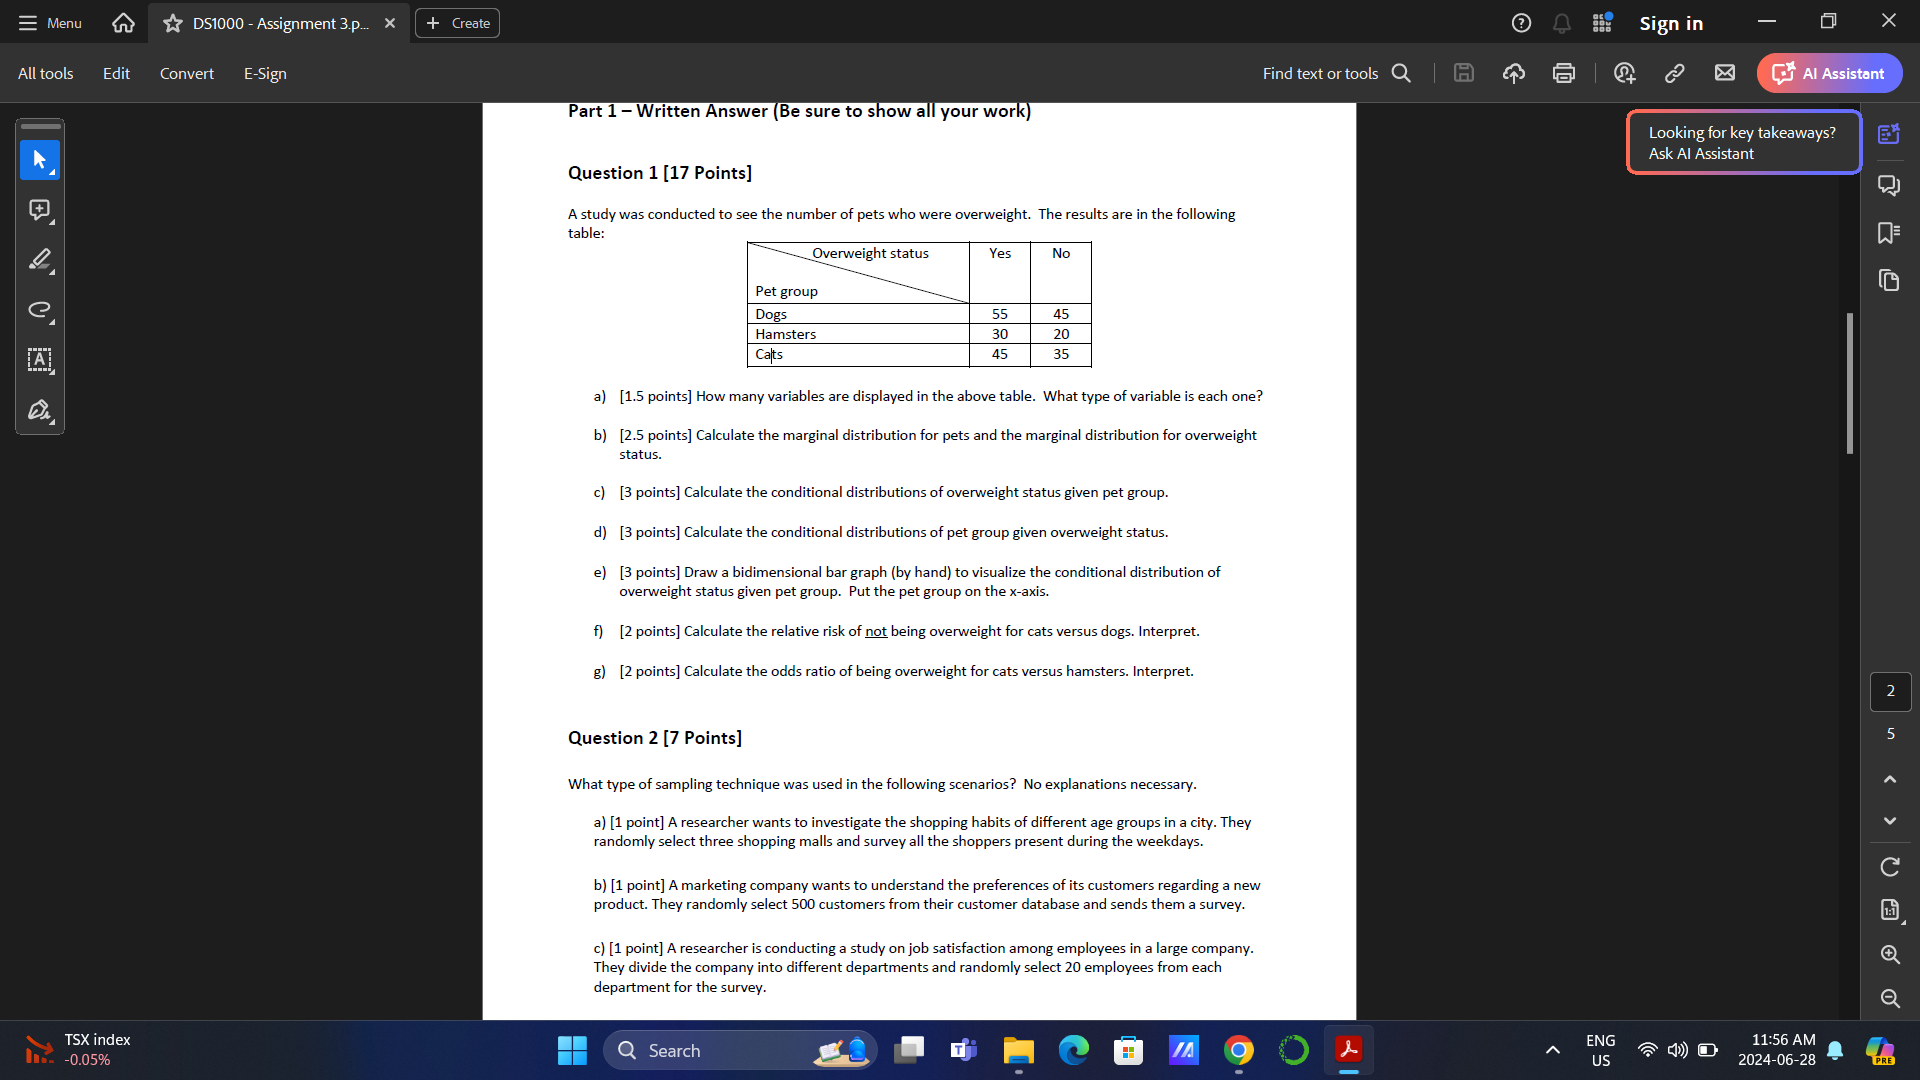
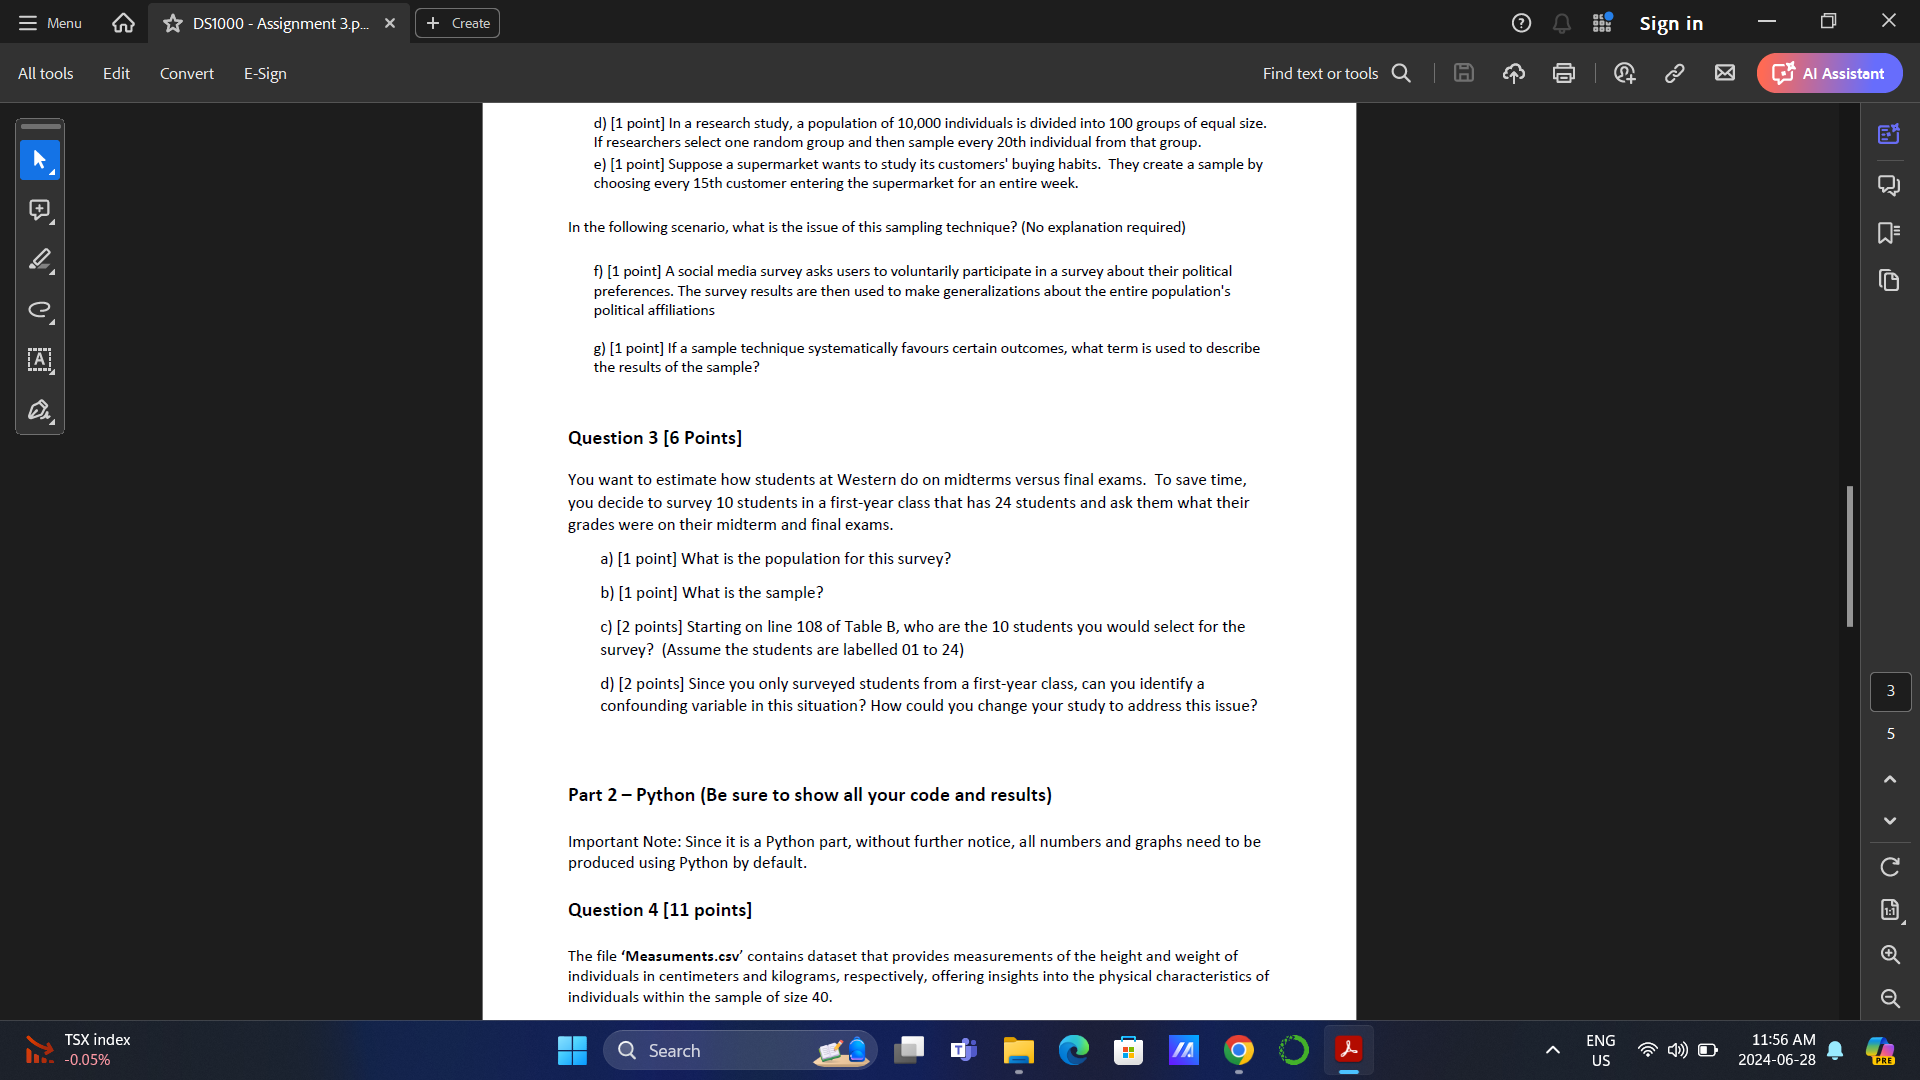
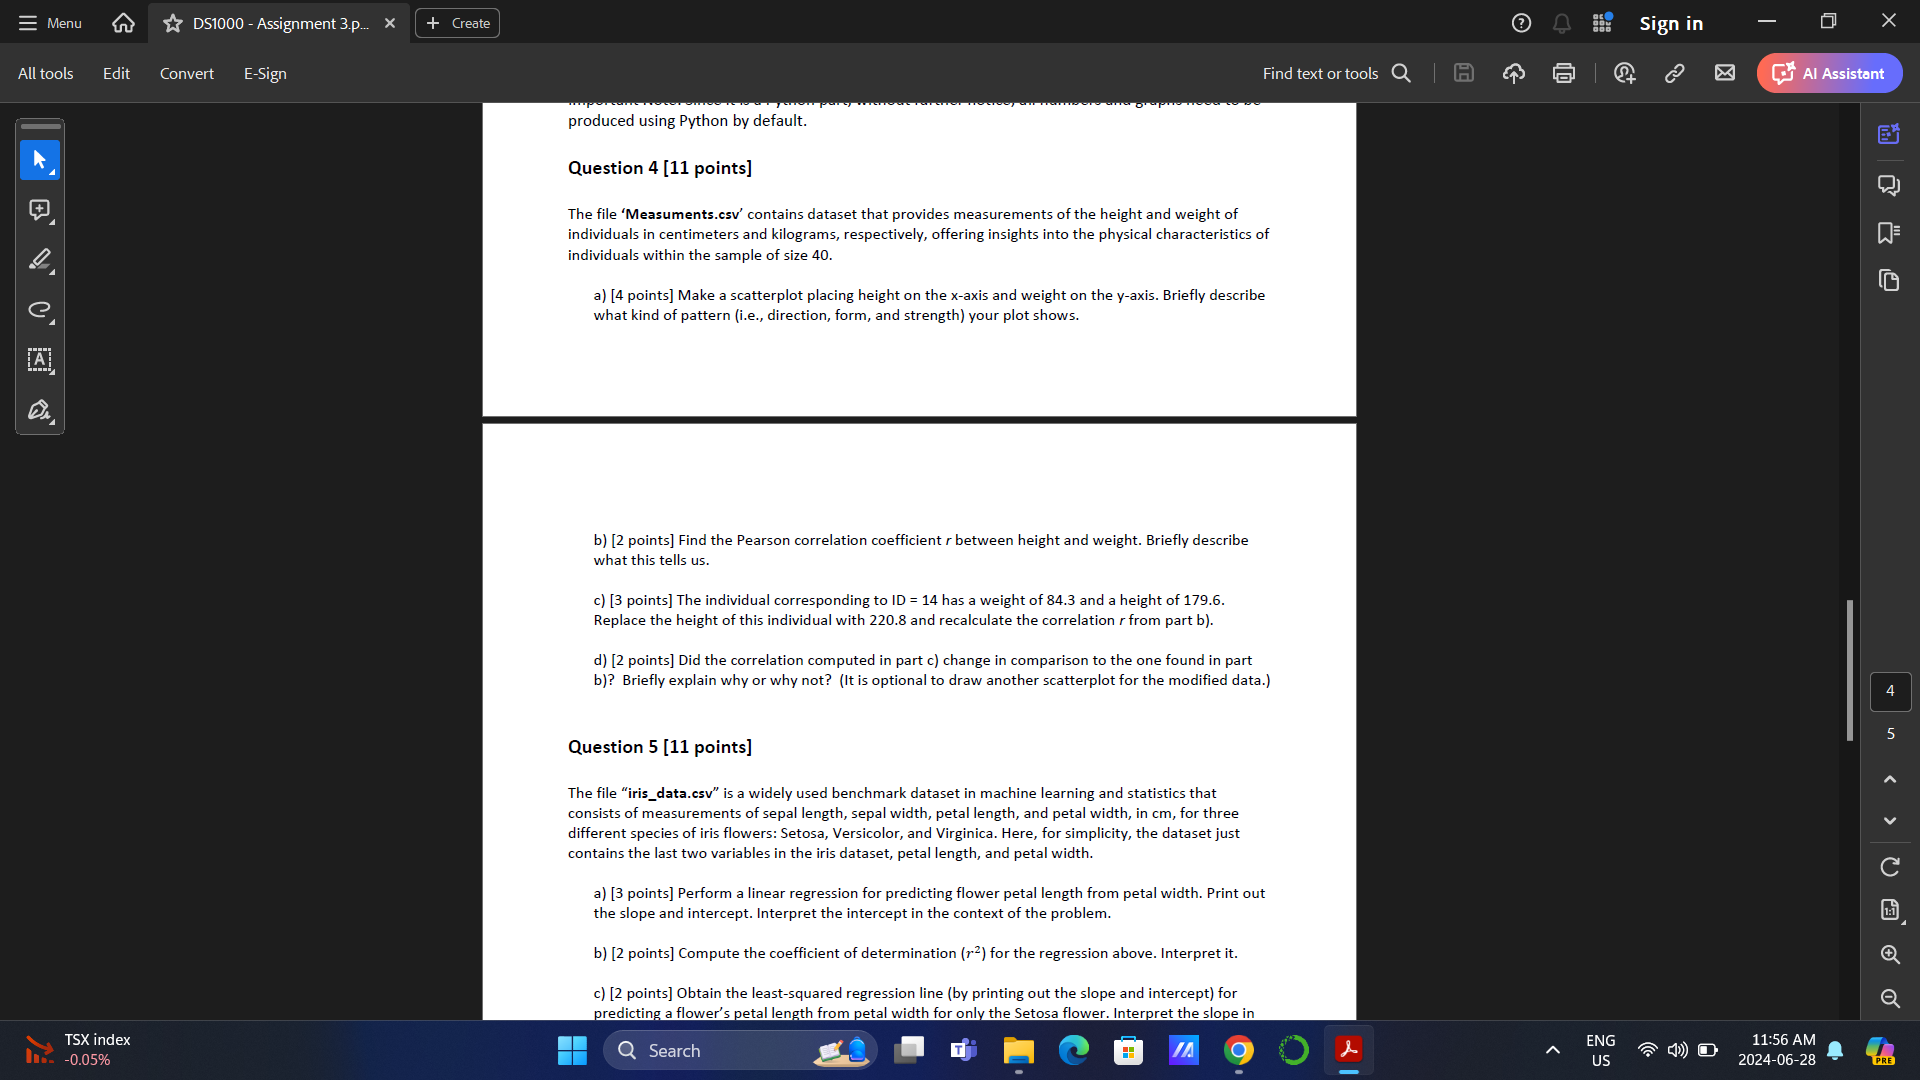
Menu DS1000 - Assignment 3.p.. X + Create Sign in X All tools Edit Convert E-Sign Find text or tools Q Al Assistant Part 1 - Written Answer (Be sure to show all your work) Looking for key takeaways? K Ask Al Assistant Question 1 [17 Points] A study was conducted to see the number of pets who were overweight. The results are in the following table Overweight status Yes No Pet group e Dog 55 45 Hamsters 30 20 Cats 45 35 a) [1.5 points] How many variables are displayed in the above table. What type of variable is each one? b) [2.5 points] Calculate the marginal distribution for pets and the marginal distribution for overweight status. c) [3 points] Calculate the conditional distributions of overweight status given pet group. d) [3 points] Calculate the conditional distributions of pet group given overweight status. e) [3 points] Draw a bidimensional bar graph (by hand) to visualize the conditional distribution of overweight status given pet group. Put the pet group on the x-axis. f) [2 points] Calculate the relative risk of not being overweight for cats versus dogs. Interpret. g) [2 points] Calculate the odds ratio of being overweight for cats versus hamsters. Interpret. Question 2 [7 Points] What type of sampling technique was used in the following scenarios? No explanations necessary. a) [1 point] A researcher wants to investigate the shopping habits of different age groups in a city. They randomly select three shopping malls and survey all the shoppers present during the weekdays. C b) [1 point] A marketing company wants to understand the preferences of its customers regarding a new product. They randomly select 500 customers from their customer database and sends them a survey. c) [1 point] A researcher is conducting a study on job satisfaction among employees in a large company. They divide the company into different departments and randomly select 20 employees from each department for the survey. TSX index ENG 11:56 AM II.. -0.05% Q Search US 2024-06-28EA TR~ P S [ R CEE T ) Alltools Edit Convert ESign I a ey d) [1 point] In a research study, a population of 10,000 individuals is divided into 100 groups of equal size. If researchers select one random group and then sample every 20th individual from that group. e) [1 point] Suppose a supermarket wants to study its customers' buying habits. They create a sample by choosing every 15th customer entering the supermarket for an entire week. In the following scenario, what is the issue of this sampling technique? (No explanation required) ) [1 point] A social media survey asks users to voluntarily participate in a survey about their pelitical preferences. The survey results are then used to make generalizations about the entire population's political affiliations g) [1 point] If a sample technique systematically favours certain outcomes, what term is used to describe the results of the sample? Question 3 [6 Points] You want to estimate how students at Western do on midterms versus final exams. To save time, you decide to survey 10 students in a first-year class that has 24 students and ask them what their grades were on their midterm and final exams. a) [1 point] What is the population for this survey? b) [1 point] What is the sample? ) [2 points] Starting on line 108 of Table B, who are the 10 students you would select for the survey? (Assume the students are labelled 01 to 24) d) [2 points] Since you only surveyed students from a first-year class, can you identify a confounding variable in this situation? How could you change your study to address this issue? Part 2 Python (Be sure to show all your code and results) Important Note: Since it is a Python part, without further notice, all numbers and graphs need to be produced using Python by default. Question 4 [11 points] The file 'Measuments.csv' contains dataset that provides measurements of the height and weight of individuals in centimeters and kilograms, respectively, offering insights into the physical characteristics of individuals within the sample of size 40. 11:56 AM 2024-06-28 ! LS s Menu DS1000 - Assignment 3.p.. X + Create Sign in X All tools Edit Convert E-Sign Find text or tools Q Al Assistant produced using Python by default. K Question 4 [11 points] The file 'Measuments.csv' contains dataset that provides measurements of the height and weight of individuals in centimeters and kilograms, respectively, offering insights into the physical characteristics of individuals within the sample of size 40. e a) [4 points] Make a scatterplot placing height on the x-axis and weight on the y-axis. Briefly describe what kind of pattern (i.e., direction, form, and strength) your plot shows. b) [2 points] Find the Pearson correlation coefficient r between height and weight. Briefly describe what this tells us. c) [3 points] The individual corresponding to ID = 14 has a weight of 84.3 and a height of 179.6. Replace the height of this individual with 220.8 and recalculate the correlation r from part b). d) [2 points] Did the correlation computed in part c) change in comparison to the one found in part b)? Briefly explain why or why not? (It is optional to draw another scatterplot for the modified data.) Question 5 [11 points] The file "iris_data.csv" is a widely used benchmark dataset in machine learning and statistics that consists of measurements of sepal length, sepal width, petal length, and petal width, in cm, for three different species of iris flowers: Setosa, Versicolor, and Virginica. Here, for simplicity, the dataset just contains the last two variables in the iris dataset, petal length, and petal width. C a) [3 points] Perform a linear regression for predicting flower petal length from petal width. Print out the slope and intercept. Interpret the intercept in the context of the problem. b) [2 points] Compute the coefficient of determination (r2) for the regression above. Interpret it. c) [2 points] Obtain the least-squared regression line (by printing out the slope and intercept) for predicting a flower's petal length from petal width for only the Setosa flower. Interpret the slope in TSX index ENG 11:56 AM II.. -0.05% Q Search US 2024-06-28
Step by Step Solution
There are 3 Steps involved in it
Step: 1
Get Instant Access to Expert-Tailored Solutions
See step-by-step solutions with expert insights and AI powered tools for academic success
Step: 2
Step: 3
Ace Your Homework with AI
Get the answers you need in no time with our AI-driven, step-by-step assistance