Mercury Athletic Footwear:
Valuing the Opportunity
Valuing Mercury Athletic
To perform a preliminary valuation, Liedtke developed a base case set of financial projections based on forecasts of revenue and operating income for each of Mercurys four main segments as shown in Exhibit 6.Liedtkes base case assumed that womens casual footwear would be wound down within one year following an acquisition, as he doubted that WCF would be willing to sell Mercury without it. He further assumed that Mercurys historical corporate overhead-to-revenue ratio would conform to historical averages. To accompany the operating projections, Liedtke prepared projections for certain balance sheet accounts for Mercury, shown in Exhibit 7; these corresponded to operating assets and liabilities that Liedtke expected would be required to support his operating projections. He did not prepare projections for debt or equity accounts since Mercury likely would not have its own balance sheet and capital structure following an acquisition by AGI. To estimate a discount rate, Liedtke planned to assume the same degree of leverage for Mercury that AGI currently used, which he estimated to be 20%, measured as debt divided by the market value of AGIs invested capital. Given current credit market conditions, he expected this degree of leverage to imply a cost of debt of 6.0%.4 Finally, his analysis would assume a 40% tax rate, equal to AGIs anticipated marginal tax rate.
After examining Mercurys value using the base case assumptions, Liedtke also wanted to consider the value of possible synergies. Specifically, he believed that AGIs inventory management system could be adopted by Mercury at little incremental cost and would reduce Mercurys DSI to the same level as AGIs. In addition, he thought it was possible that Mercurys womens casual footwear line could be folded into Active Gears, rather than discontinued. In that case, he thought the combined businesses could achieve an EBIT margin of 9% and revenue growth of 3%.
For this Case Study, do NOTsolve for the discount rate using WACC, rather use a given discount rate in the 6% to 10% range.
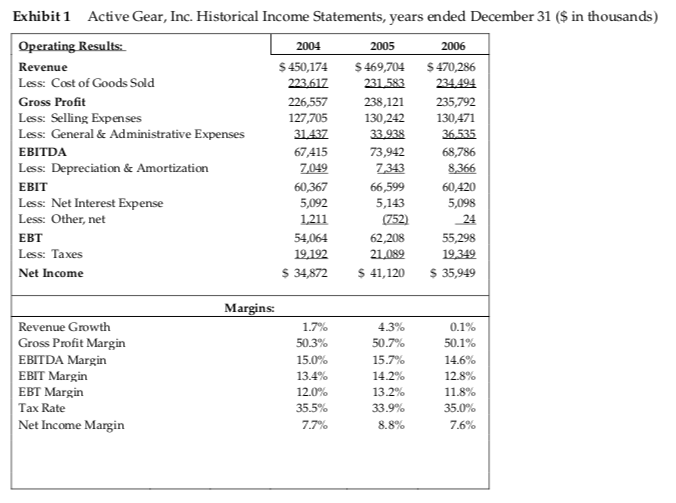
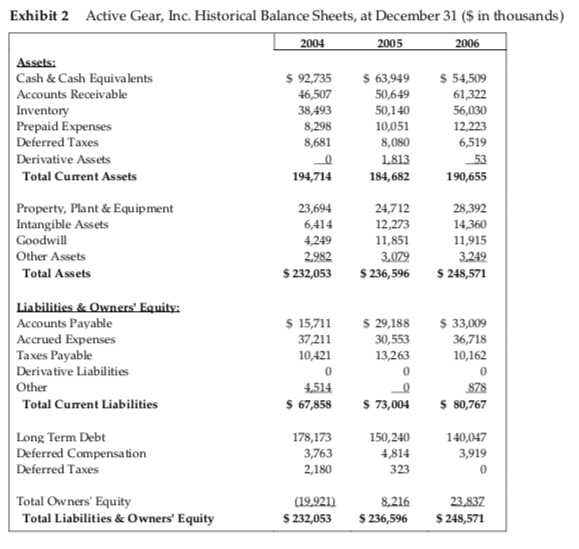
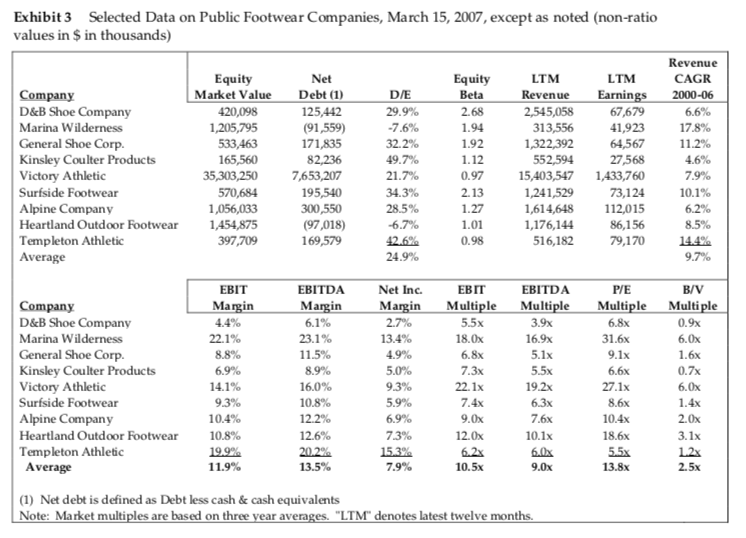
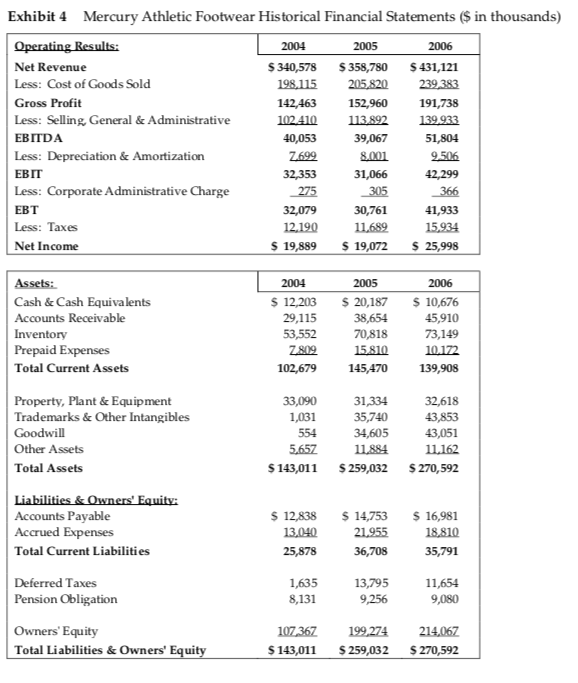
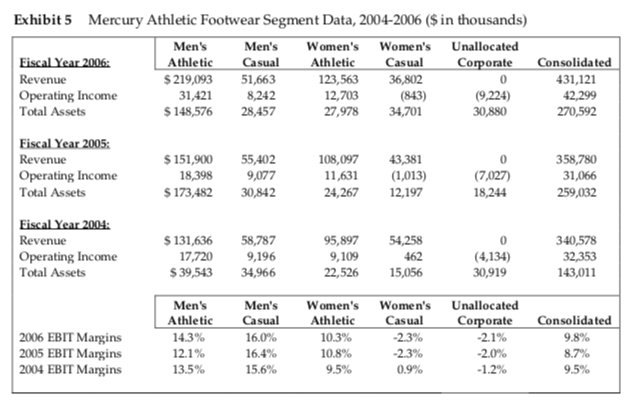
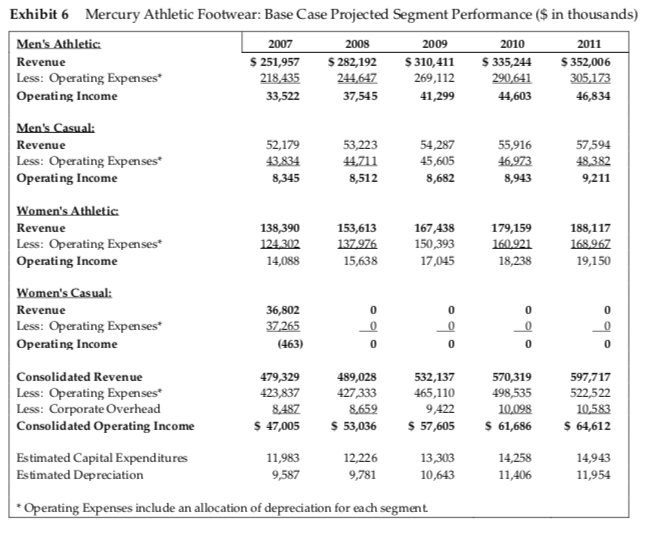
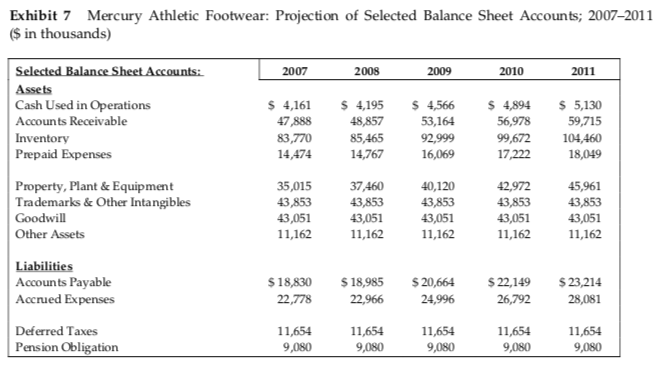
Exhibit1 Active Gear, Inc. Historical Income Statements, years ended December 31 (S in thousands) Revenue Less: Cost of Goods Sold Gross Profit Less: Selling Expenses Less: General & Administrative Expenses EBITDA Less: Depreciation & Amortization EBIT Less: Net Interest Expense Less: Other, net EBT Less: Taxes Net Income $450,174 $469,704 $470,286 231583 234494 238,121 235,792 130,242 130,471 127,.705 67,415 73,942 60,367 5,092 66,599 60,420 5,143 62,208 34,872 $41,120 $ 5,098 55,298 35,949 Margins: Revenue Growth Gross Profit Margin EBITDA Margin EBIT Margin EBT Margin Tax Rate Net Income Margin 1.7% 50.3% 15.0% 13.4% 43% 50.7% 15.7% 14.2% 13.2% 33.9% 8.8% 0.1% 50.1% 14.6% 35.5% 77% 11.8% 35.0% 75% Exhibit 2 Active Gear, Inc. Historical Balance Sheets, at December 31 ($ in thousands) 2005 Cash & Cash Equivalents Accounts Receivable Inventory Prepaid Expenses Deferred Taxes Derivative Assets 92,735 63,949 50,649 50,140 10,051 8,080 L813 184,682 54,50 46,507 61,322 38,493 8,681 194,714 23,694 12,223 6,519 Total Current Assets 190,655 Property, Plant&Equipment Intangible Assets Goodwill Other Assets 24,712 6,414 14,360 11,915 11,851 3,079 Total Assets S 232,053 S236,596 248,571 Accounts Payable Accrued Expenses Taxes Payable Derivative Liabilities Other 15,7$ 29,188 30,553 13,263 0 37.211 10,421 0 33,00 36,718 10,162 Total Current Liabilities 67,858 73,004 80,767 Long Term Debt Deferred Compensation Deferred Taxes 178,173 3,763 2,180 150,240 4,814 323 140,047 3,919 0 Total Owners' Equity 8,216 Total Liabilities & Owners' Equity S 232,053 $236,596 $248,571 Exhibit3 Selected Data on Public Footwear Companies, March 15, 2007, except as noted (non-ratio Market Value Debt (1) Kinsley Coulter Products 7,6 Margin Multiple Multiple Multiple Multiple 5 (1) Net debt is defined as Debt less cash & cash equivalents Note: Market multiples are based on three vear averages. "LTM" denotes latest twelve months. Exhibit 4 Mercury Athletic Footwear Historical Financial Statements $in thousands) 2004 2005 2006 Net Revenue Less: Cost of Goods Sold Gross Profit Less: Selling, General & Administrative EBITDA Less: Depreciation & Amortization EBIT Less: Corporate Administrative Charge EBT Less: Taxes Net Income S 340,578 S358,780 S431,121 198,115 205820 239383 191,738 102410 113892 139.933 51,804 9506 142,463 152,960 39,067 32,353 31,066 41,933 15,934 S 19,88919,072 S 25,998 32,079 30,761 11689 12.190 Assets: Cash & Cash Equivalents Accounts Receivable Inventory Prepaid Expenses Total Current Assets 2005 S 12,203 20,187 38,654 70,818 ZS02 15810 2006 10,676 45,910 73,149 29,115 53,552 145,470 139,908 Property, Plant & Equipment Trademarks & Other Intangibles 32,618 43,853 43,051 11162 S 143,011 S259,032 S270,592 33,090 1,031 31,334 35,740 34,605 Other Assets Total Assets Accounts Payable Accrued Expenses Total Current Liabilities 12,838 14,753 16,981 21955 18.810 35,791 36,708 Deferred Taxes 1,635 8,131 13,795 9,256 11,654 9,080 Pension Obligation Owners' Equity Total Liabilities&Owners' Equit 107,36 199,274 214,067 S 143,011 S259,032 $ 270,592 Exhibit5 Mercury Athletic Footwear Segment Data, 2004-2006 ($ in thousands) Men's Men's Women's Women's Unallocated Athletic Casual 219,093 51,663 8,242 148,576 28,457 Athletic Casual 123,563 36,802 (843) 27,978 34,701 Corporate Consolidated Revenue Operating Income Total Assets 431,121 42,299 270,592 0 31,421 12,703 9,224) 30,880 Fiscal Year 2005: Operating Income Total Assets 151,900 55,402 18,398 9,077 S173,482 30,842 08,097 43,381 11,631 (1,013) 24,267 12,197 0 7,027) 18,244 358,780 31,066 259,032 Revenue Operating Income Total Assets 131,636 58,787 7,7209,196 39,54334,966 95,897 54,258 462 22,526 15,056 0 (4,134) 30,919 340,578 32,353 143,011 9,109 Men's Athletic 14.3% 12.1% 13.5% Men's Women's Women's Unallocated Casual 16.0% 16.4% 15.6% Athletic 10.3% 10.8% 9.5% Casual -2.3% -2.3% 0.9% Coporate Consolidated 2006 EBIT Margins 2005 EBIT Margins 2004 EBIT Margins -21% -2.0% 9.8% 8.7% 9.5% Exhibit 6Mercury Athletic Footwear: Base Case Projected Segment Performance ($ in thousands) 2007 2008 2009 2010 2011 S 251,957 $282,192 $310,411 $335,244 $352,006 Revenue Less: Operating Expenses Operating Income 218435 244647 269,112 37,545 90,641 41,299 46,834 52,179 43,834 54,287 45,605 8,682 55,916 46,973 8,943 57,594 Revenue Less: Operating Expenses Operating Income 44,711 8,512 9,211 179,159 188,117 Revenue Less: Operating Expenses Operating Income 153,613 167,438 150,393 17,045 14,088 15,638 18,238 19,150 Revenue Less: Operating Expenses Operating Income 265 Consolidated Revenue Less: Operating Expenses Less: Corporate Overhead Consolidated Operating Income 489,028 427,333 8,659 479,329 423,837 8,487 532,137 465,110 ,717 522,522 570,319 9,422 10,.098 S 47,005 S53,036 S 57,605 61,686 64,612 Estimated Capital Expenditures Estimated Depreciation 11,983 9,587 12,226 9,781 13,303 10,643 14,258 11,406 14,943 11,954 tin include an allocation of ation for each segment Exhibit 7 Mercury Athletic Footwear: Projection of Selected Balance Sheet Accounts; 2007-2011 $ in thousands) 2007 2008 2009 2010 2011 Assets Cash Used in Operations Accounts Receivable Inventory Prepaid Expenses 4,161 47,888 83,770 14,474 4,195 48,857 85,465 14,767 53,164 92,999 16,069 4,566 4,894 $ 5,130 56,978 99,672 17,222 59,715 104,460 18,049 Property, Plant&Equipment Trademarks& Other Intangibles Goodwill Other Assets 35,015 43,853 43,051 11,162 37,460 43,853 43,051 11,162 40,120 43,853 43,051 11,162 42,972 43,853 43,051 11,162 45,961 43,853 43,051 11,162 Accounts Payable Accrued Expenses S18,830 18,985 20,664 $22,149 23,214 22,778 22,966 24,996 26,792 28,081 Deferred Taxes Pension Obligation 11,654 9,080 11,654 9,080 11,654 9,080 11,654 9,080 11,654 9,080 Exhibit1 Active Gear, Inc. Historical Income Statements, years ended December 31 (S in thousands) Revenue Less: Cost of Goods Sold Gross Profit Less: Selling Expenses Less: General & Administrative Expenses EBITDA Less: Depreciation & Amortization EBIT Less: Net Interest Expense Less: Other, net EBT Less: Taxes Net Income $450,174 $469,704 $470,286 231583 234494 238,121 235,792 130,242 130,471 127,.705 67,415 73,942 60,367 5,092 66,599 60,420 5,143 62,208 34,872 $41,120 $ 5,098 55,298 35,949 Margins: Revenue Growth Gross Profit Margin EBITDA Margin EBIT Margin EBT Margin Tax Rate Net Income Margin 1.7% 50.3% 15.0% 13.4% 43% 50.7% 15.7% 14.2% 13.2% 33.9% 8.8% 0.1% 50.1% 14.6% 35.5% 77% 11.8% 35.0% 75% Exhibit 2 Active Gear, Inc. Historical Balance Sheets, at December 31 ($ in thousands) 2005 Cash & Cash Equivalents Accounts Receivable Inventory Prepaid Expenses Deferred Taxes Derivative Assets 92,735 63,949 50,649 50,140 10,051 8,080 L813 184,682 54,50 46,507 61,322 38,493 8,681 194,714 23,694 12,223 6,519 Total Current Assets 190,655 Property, Plant&Equipment Intangible Assets Goodwill Other Assets 24,712 6,414 14,360 11,915 11,851 3,079 Total Assets S 232,053 S236,596 248,571 Accounts Payable Accrued Expenses Taxes Payable Derivative Liabilities Other 15,7$ 29,188 30,553 13,263 0 37.211 10,421 0 33,00 36,718 10,162 Total Current Liabilities 67,858 73,004 80,767 Long Term Debt Deferred Compensation Deferred Taxes 178,173 3,763 2,180 150,240 4,814 323 140,047 3,919 0 Total Owners' Equity 8,216 Total Liabilities & Owners' Equity S 232,053 $236,596 $248,571 Exhibit3 Selected Data on Public Footwear Companies, March 15, 2007, except as noted (non-ratio Market Value Debt (1) Kinsley Coulter Products 7,6 Margin Multiple Multiple Multiple Multiple 5 (1) Net debt is defined as Debt less cash & cash equivalents Note: Market multiples are based on three vear averages. "LTM" denotes latest twelve months. Exhibit 4 Mercury Athletic Footwear Historical Financial Statements $in thousands) 2004 2005 2006 Net Revenue Less: Cost of Goods Sold Gross Profit Less: Selling, General & Administrative EBITDA Less: Depreciation & Amortization EBIT Less: Corporate Administrative Charge EBT Less: Taxes Net Income S 340,578 S358,780 S431,121 198,115 205820 239383 191,738 102410 113892 139.933 51,804 9506 142,463 152,960 39,067 32,353 31,066 41,933 15,934 S 19,88919,072 S 25,998 32,079 30,761 11689 12.190 Assets: Cash & Cash Equivalents Accounts Receivable Inventory Prepaid Expenses Total Current Assets 2005 S 12,203 20,187 38,654 70,818 ZS02 15810 2006 10,676 45,910 73,149 29,115 53,552 145,470 139,908 Property, Plant & Equipment Trademarks & Other Intangibles 32,618 43,853 43,051 11162 S 143,011 S259,032 S270,592 33,090 1,031 31,334 35,740 34,605 Other Assets Total Assets Accounts Payable Accrued Expenses Total Current Liabilities 12,838 14,753 16,981 21955 18.810 35,791 36,708 Deferred Taxes 1,635 8,131 13,795 9,256 11,654 9,080 Pension Obligation Owners' Equity Total Liabilities&Owners' Equit 107,36 199,274 214,067 S 143,011 S259,032 $ 270,592 Exhibit5 Mercury Athletic Footwear Segment Data, 2004-2006 ($ in thousands) Men's Men's Women's Women's Unallocated Athletic Casual 219,093 51,663 8,242 148,576 28,457 Athletic Casual 123,563 36,802 (843) 27,978 34,701 Corporate Consolidated Revenue Operating Income Total Assets 431,121 42,299 270,592 0 31,421 12,703 9,224) 30,880 Fiscal Year 2005: Operating Income Total Assets 151,900 55,402 18,398 9,077 S173,482 30,842 08,097 43,381 11,631 (1,013) 24,267 12,197 0 7,027) 18,244 358,780 31,066 259,032 Revenue Operating Income Total Assets 131,636 58,787 7,7209,196 39,54334,966 95,897 54,258 462 22,526 15,056 0 (4,134) 30,919 340,578 32,353 143,011 9,109 Men's Athletic 14.3% 12.1% 13.5% Men's Women's Women's Unallocated Casual 16.0% 16.4% 15.6% Athletic 10.3% 10.8% 9.5% Casual -2.3% -2.3% 0.9% Coporate Consolidated 2006 EBIT Margins 2005 EBIT Margins 2004 EBIT Margins -21% -2.0% 9.8% 8.7% 9.5% Exhibit 6Mercury Athletic Footwear: Base Case Projected Segment Performance ($ in thousands) 2007 2008 2009 2010 2011 S 251,957 $282,192 $310,411 $335,244 $352,006 Revenue Less: Operating Expenses Operating Income 218435 244647 269,112 37,545 90,641 41,299 46,834 52,179 43,834 54,287 45,605 8,682 55,916 46,973 8,943 57,594 Revenue Less: Operating Expenses Operating Income 44,711 8,512 9,211 179,159 188,117 Revenue Less: Operating Expenses Operating Income 153,613 167,438 150,393 17,045 14,088 15,638 18,238 19,150 Revenue Less: Operating Expenses Operating Income 265 Consolidated Revenue Less: Operating Expenses Less: Corporate Overhead Consolidated Operating Income 489,028 427,333 8,659 479,329 423,837 8,487 532,137 465,110 ,717 522,522 570,319 9,422 10,.098 S 47,005 S53,036 S 57,605 61,686 64,612 Estimated Capital Expenditures Estimated Depreciation 11,983 9,587 12,226 9,781 13,303 10,643 14,258 11,406 14,943 11,954 tin include an allocation of ation for each segment Exhibit 7 Mercury Athletic Footwear: Projection of Selected Balance Sheet Accounts; 2007-2011 $ in thousands) 2007 2008 2009 2010 2011 Assets Cash Used in Operations Accounts Receivable Inventory Prepaid Expenses 4,161 47,888 83,770 14,474 4,195 48,857 85,465 14,767 53,164 92,999 16,069 4,566 4,894 $ 5,130 56,978 99,672 17,222 59,715 104,460 18,049 Property, Plant&Equipment Trademarks& Other Intangibles Goodwill Other Assets 35,015 43,853 43,051 11,162 37,460 43,853 43,051 11,162 40,120 43,853 43,051 11,162 42,972 43,853 43,051 11,162 45,961 43,853 43,051 11,162 Accounts Payable Accrued Expenses S18,830 18,985 20,664 $22,149 23,214 22,778 22,966 24,996 26,792 28,081 Deferred Taxes Pension Obligation 11,654 9,080 11,654 9,080 11,654 9,080 11,654 9,080 11,654 9,080