Answered step by step
Verified Expert Solution
Link Copied!

Question

1 Approved Answer

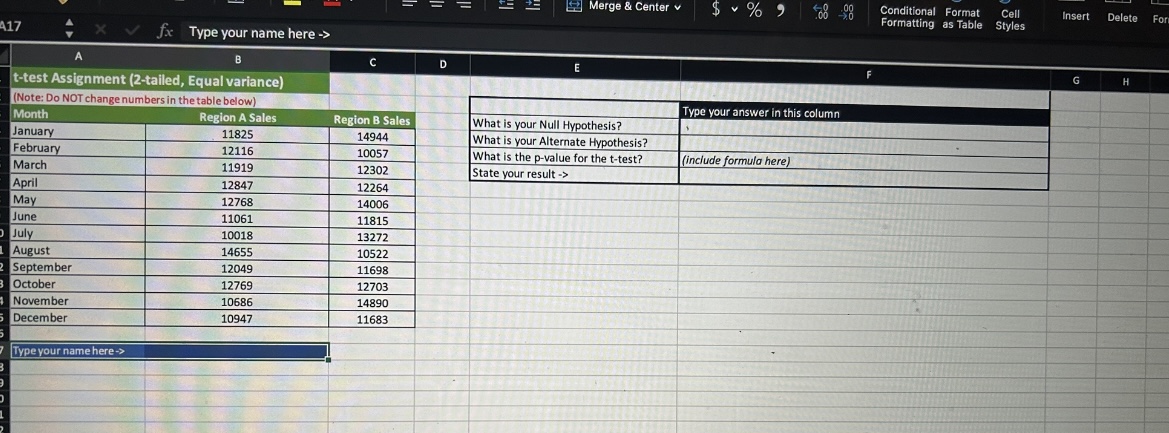
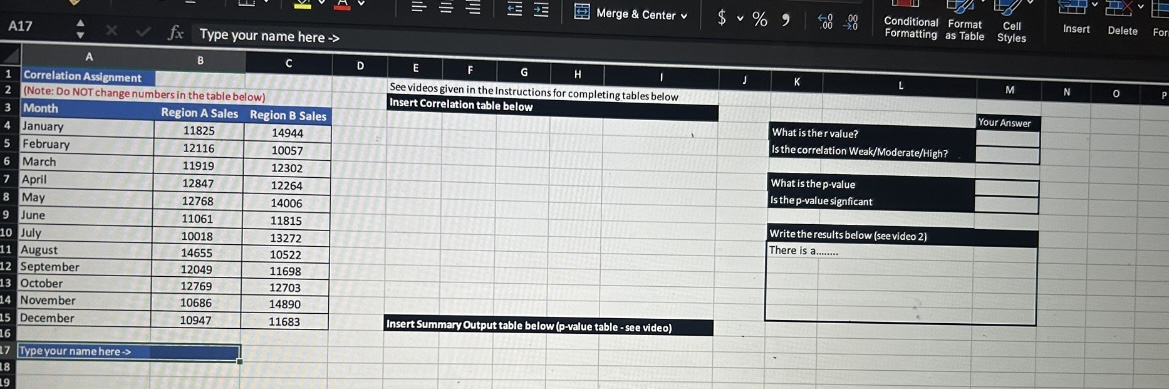
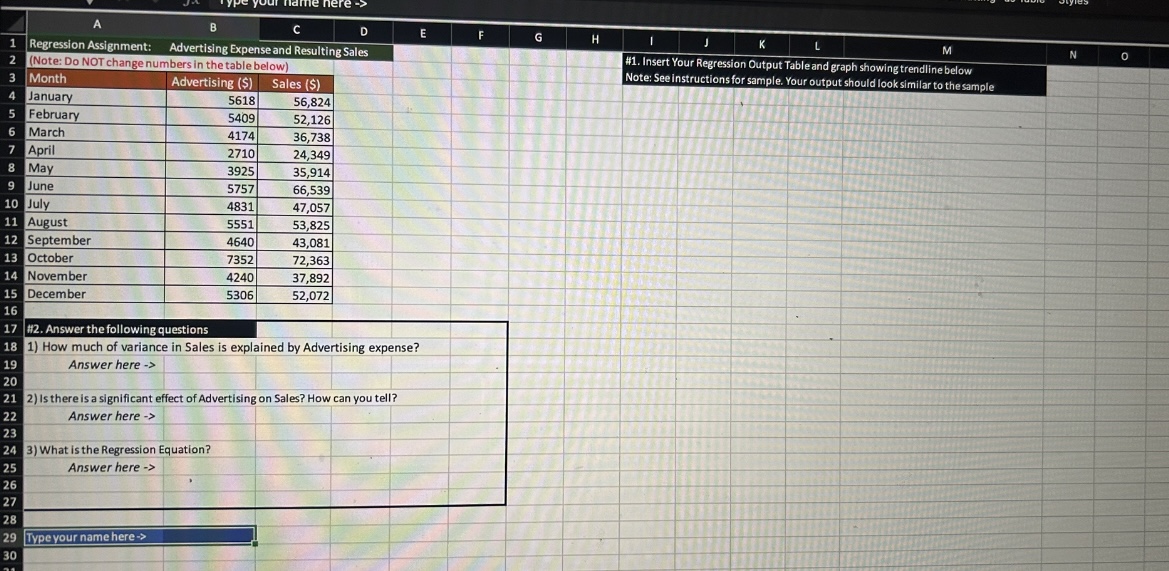
Merge & Center v $ v % 78 Conditional Format Cell Insert Delete Formatting as Table For Styles 417 X V fax Type your

image text in transcribedimage text in transcribedimage text in transcribed
Merge & Center v $ v % " 78 Conditional Format Cell Insert Delete Formatting as Table For Styles 417 X V fax Type your name here -> B C D E G H t-test Assignment (2-tailed, Equal variance) (Note: Do NOT change numbers in the table below) Type your answer in this column Month Region A Sales Region B Sales What is your Null Hypothesis? January 11825 14944 What is your Alternate Hypothesis? February 12116 10057 What is the p-value for the t-test? (include formula here) March 11919 12302 State your result -> Apri 12847 12264 May 12768 14006 June 11061 11815 July 10018 13272 August 14655 10522 September 12049 11698 October 12769 12703 November 10686 14890 December 10947 11683 Type your name here->Merge & Center v $ v % Conditional Format Cell Insert Delete For Formatting as Table Styles A17 x v fx Type your name here -> B C D E F G H J K L M N 0 Correlation Assignment See videos given in the Instructions for completing tables below (Note: Do NOT change numbers in the table below) Insert Correlation table below Your Answer Month Region A Sales Region B Sales What is ther value? January 11825 14944 Is the correlation Weak/Moderate/High? February 12116 10057 6 March 11919 12302 What is the p-value April 12847 12264 Is the p-value signficant 8 May 12768 14006 June 11061 11815 Write the results below (see video 2] 10 July 10018 13272 There is a...... 11 August 14655 10522 12 September 12049 11698 13 October 12769 12703 November 10686 14890 December 10947 11683 Insert Summary Output table below (p-value table - see video) 6 [Type your name here -> 8lame here -> B C D E F G H K M N O 1 Regression Assignment: Advertising Expense and Resulting Sales #1. Insert Your Regression Output Table and graph showing trendline below IN (Note: Do NOT change numbers in the table below Note: See instructions for sample. Your output should look similar to the sample 3 Month Advertising ($) Sales ($) January 5618 56,824 5 February 5409 52,126 6 March 4174 36,738 April 2710 24,349 8 May 3925 35,914 9 June 5757 66,539 10 July 4831 47,057 11 August 5551 53,825 12 September 4640 43,081 13 October 7352 72,363 14 November 4240 37,892 15 December 5306 52,072 16 17 #2. Answer the following questions 18 1) How much of variance in Sales is explained by Advertising expense? 19 Answer here -> 20 21 2) Is there is a significant effect of Advertising on Sales? How can you tell? 22 Answer here -> 23 24 3) What is the Regression Equation? 25 Answer here -> 26 27 28 29 Type your name here -> 30

Step by Step Solution

There are 3 Steps involved in it

Step: 1

blur-text-image

Get Instant Access to Expert-Tailored Solutions

See step-by-step solutions with expert insights and AI powered tools for academic success

Step: 2

blur-text-image

Step: 3

blur-text-image

Ace Your Homework with AI

Get the answers you need in no time with our AI-driven, step-by-step assistance

Get Started

Recommended Textbook for

Quantitative Methods For Business

Authors: David Anderson, Dennis Sweeney, Thomas Williams, Jeffrey Cam

11th Edition

978-0324651812, 324651813, 978-0324651751

More Books

Students also viewed these General Management questions