Answered step by step
Verified Expert Solution
Link Copied!

Question

1 Approved Answer

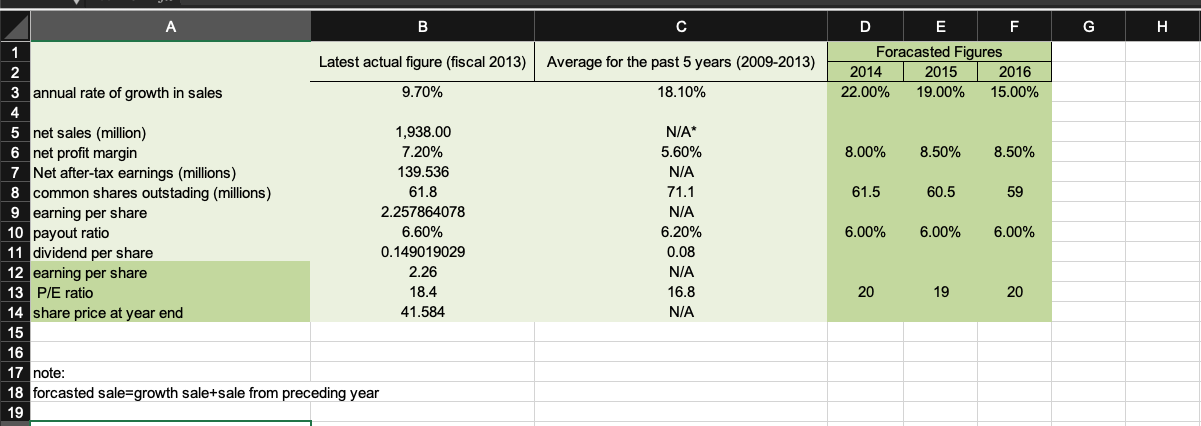
mesure the forcasted price and forcasted dividends also Interpetate the results A B G . 1 Latest actual figure (fiscal 2013) Average for the past

mesure the forcasted price and forcasted dividends

also Interpetate the results

image text in transcribed

A B G . 1 Latest actual figure (fiscal 2013) Average for the past 5 years (2009-2013) D E F Foracasted Figures 2014 2015 2016 22.00% 19.00% 15.00% 3 annual rate of growth in sales 9.70% 18.10% 8.00% 8.50% 8.50% 61.5 60.5 59 N/A 5.60% N/A 71.1 N/A 6.20% 0.08 N/A 16.8 N/A 6.00% 6.00% 5 net sales (million) 1,938.00 6 net profit margin 7.20% 7 Net after-tax earnings (millions) 139.536 8 common shares outstading (millions) 61.8 9 earning per share 2.257864078 10 payout ratio 6.60% 11 dividend per share 0.149019029 12 earning per share 2.26 13 P/E ratio 18.4 14 share price at year end 41.584 15 16 17 note: 18 forcasted sale=growth sale+sale from preceding year 19 6.00% 20 19 20

Step by Step Solution

There are 3 Steps involved in it

Step: 1

blur-text-image

Get Instant Access to Expert-Tailored Solutions

See step-by-step solutions with expert insights and AI powered tools for academic success

Step: 2

blur-text-image

Step: 3

blur-text-image

Ace Your Homework with AI

Get the answers you need in no time with our AI-driven, step-by-step assistance

Get Started

Recommended Textbook for

Finance And Investments Application To South African Financial Markets

Authors: Mthuli Ncube

1st Edition

3843375984, 9783843375986

More Books

Students also viewed these Finance questions