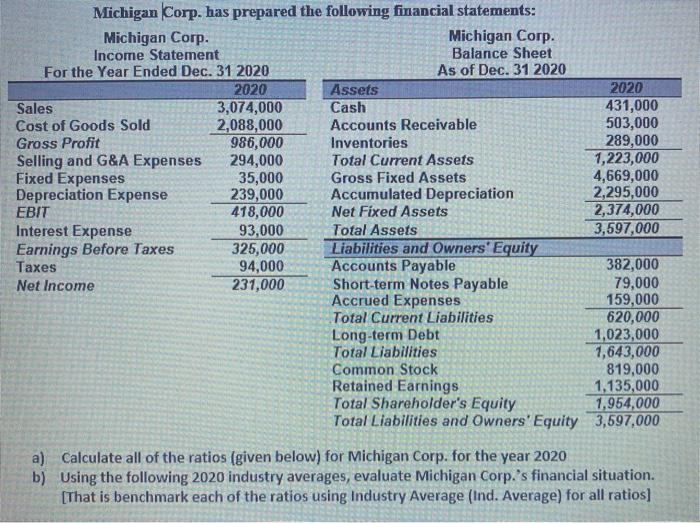
Michigan Corp. has prepared the following financial statements: Michigan Corp. Michigan Corp. Income Statement Balance Sheet For the Year Ended Dec. 31 2020 As of Dec. 31 2020 2020 Assets 2020 Sales 3,074,000 Cash 431,000 Cost of Goods Sold 2,088,000 Accounts Receivable 503,000 Gross Profit 986,000 Inventories 289,000 Selling and G&A Expenses 294,000 Total Current Assets 1,223,000 Fixed Expenses 35,000 Gross Fixed Assets 4,669,000 Depreciation Expense 239,000 Accumulated Depreciation 2,295,000 EBIT 418,000 Net Fixed Assets 2,374,000 Interest Expense 93,000 Total Assets 3,597,000 Earnings Before Taxes 325,000 Liabilities and Owners' Equity Taxes 94,000 Accounts Payable 382,000 Net Income 231,000 Short-term Notes Payable 79,000 Accrued Expenses 159,000 Total Current Liabilities 620,000 Long-term Debt 1,023,000 Total Liabilities 1,643,000 Common Stock 819,000 Retained Earnings 1,135,000 Total Shareholder's Equity 1,954,000 Total Liabilities and Owners' Equity 3,597,000 a) Calculate all of the ratios (given below) for Michigan Corp. for the year 2020 b) Using the following 2020 industry averages, evaluate Michigan Corp.'s financial situation. [That is benchmark each of the ratios using Industry Average (Ind. Average) for all ratios) Ratio Ind. Average FIRM Times Interest Earned 2.5 Ratio Current Ratio Quick Ratio Inventory Turnover Ratio Accounts Receivable Turnover Ratio Average Collection Period (Day's sales in receivables) Ind. Average FIRM 2.5x 0.6x 6.5% 3.0x 30.0 days 2.0x 40.096 Profit Margin Return on Total Assets 5.096 6,0% Total Asset Turnover Total Debt Ratio Return on Common Equity 10.096 Benchmarking Example (not related to above data): (Need to Benchmark all the ratios above) Ratio Firm Value Industry Average Comment Return on Equity (ROE) 9.896 5.896 Good Current Ratio 3.0x Poor