Microsoft 2019 and 2016 annual reports are used to answer these questions.
***note: annual reports of Microsoft from 2015 to 2019 are added below and if the picture isn't visible use this link (https://www.microsoft.com/investor/reports/ar19/index.html) for years 2017 to 2019 and this link (https://www.microsoft.com/investor/reports/ar16/index.html) for years 2015 to 2019.
6. One of the lessons of chapter 10 and 11 are that research and development is expensed. A hypothetical alternative (not allowed under generally accepted accounting principles) is to amortize over five years. Indicate the R&D for each of the past five years, including 2019, the total amount, as well as the average. The 2019 annual report will give you information for the past 3 years. Go to the 2016 annual report to get data for 2015 and 2016.
7. What would income before taxes be if Microsoft amortized R&D over 5 years (use the average you calculated above) rather than immediate expensing?
8. How much higher and lower would income before taxes be? Also indicate percentage difference.
9. Optional: comment on what you have learned. Are you in favor of current GAAP to expense R&D or would you prefer to capitalize and amortize. Explain your reasoning.
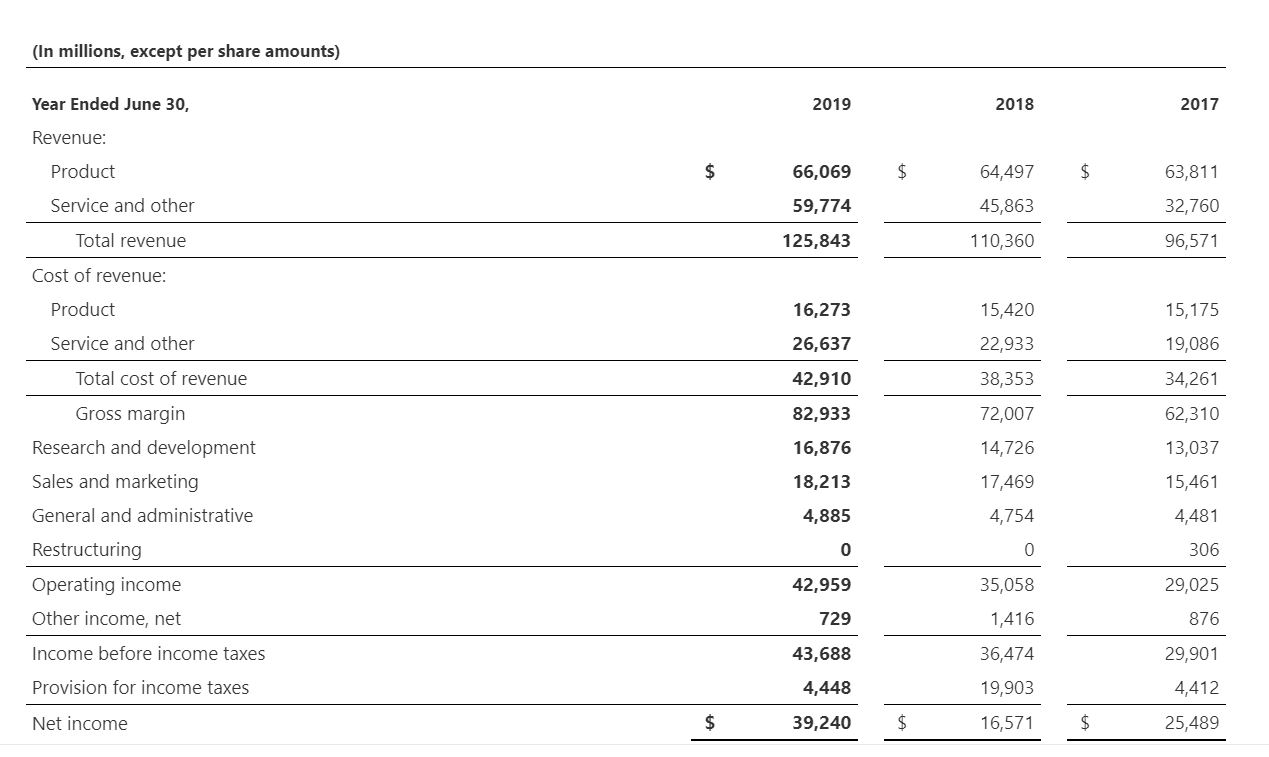
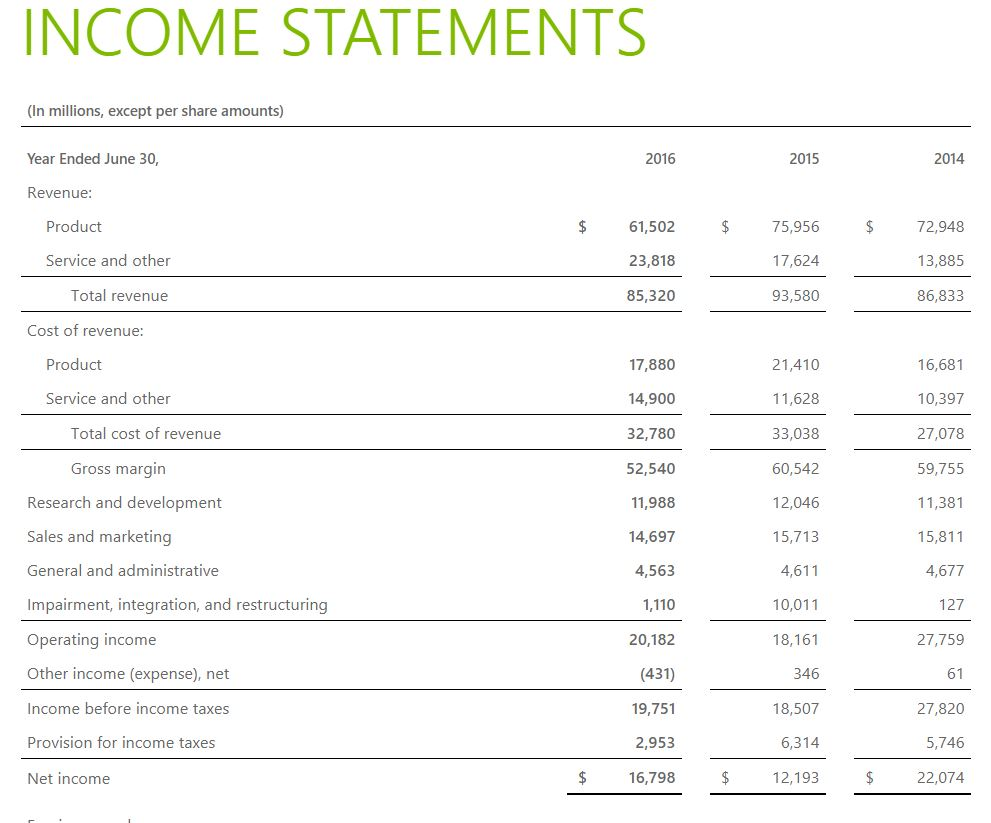
(In millions, except per share amounts) 2019 2018 2017 Year Ended June 30, Revenue: Product Service and other $ 66,069 59,774 64,497 45,863 63,811 32,760 Total revenue 125,843 110,360 96,571 15,420 16,273 26,637 15,175 19,086 22,933 42,910 34,261 82,933 Cost of revenue: Product Service and other Total cost of revenue Gross margin Research and development Sales and marketing General and administrative Restructuring Operating income Other income, net Income before income taxes Provision for income taxes 62,310 13,037 38,353 72,007 14,726 17,469 4,754 16,876 18,213 15,461 4,885 4,481 0 306 29,025 42,959 729 35,058 1,416 876 43,688 4,448 39,240 36,474 19,903 16,571 29,901 4,412 Net income $ $ 25,489 INCOME STATEMENTS (In millions, except per share amounts) Year Ended June 30, 2016 2015 2014 Revenue: Product 61,502 75,956 72,948 Service and other 23,818 17,624 13,885 Total revenue 85,320 93,580 86,833 Cost of revenue: Product 17,880 21,410 16,681 Service and other 14,900 11,628 10,397 Total cost of revenue 32,780 33,038 27,078 Gross margin 52,540 60,542 59,755 Research and development 11,988 12,046 11,381 Sales and marketing 14,697 15,713 15,811 General and administrative 4,563 4,611 4,677 Impairment, integration, and restructuring 1,110 10,011 127 Operating income 20,182 18,161 27,759 Other income (expense), net (431) 346 61 Income before income taxes 19,751 18,507 27,820 Provision for income taxes 2,953 6,314 5,746 Net income $ 16,798 $ 12,193 $ 22,074 (In millions, except per share amounts) 2019 2018 2017 Year Ended June 30, Revenue: Product Service and other $ 66,069 59,774 64,497 45,863 63,811 32,760 Total revenue 125,843 110,360 96,571 15,420 16,273 26,637 15,175 19,086 22,933 42,910 34,261 82,933 Cost of revenue: Product Service and other Total cost of revenue Gross margin Research and development Sales and marketing General and administrative Restructuring Operating income Other income, net Income before income taxes Provision for income taxes 62,310 13,037 38,353 72,007 14,726 17,469 4,754 16,876 18,213 15,461 4,885 4,481 0 306 29,025 42,959 729 35,058 1,416 876 43,688 4,448 39,240 36,474 19,903 16,571 29,901 4,412 Net income $ $ 25,489 INCOME STATEMENTS (In millions, except per share amounts) Year Ended June 30, 2016 2015 2014 Revenue: Product 61,502 75,956 72,948 Service and other 23,818 17,624 13,885 Total revenue 85,320 93,580 86,833 Cost of revenue: Product 17,880 21,410 16,681 Service and other 14,900 11,628 10,397 Total cost of revenue 32,780 33,038 27,078 Gross margin 52,540 60,542 59,755 Research and development 11,988 12,046 11,381 Sales and marketing 14,697 15,713 15,811 General and administrative 4,563 4,611 4,677 Impairment, integration, and restructuring 1,110 10,011 127 Operating income 20,182 18,161 27,759 Other income (expense), net (431) 346 61 Income before income taxes 19,751 18,507 27,820 Provision for income taxes 2,953 6,314 5,746 Net income $ 16,798 $ 12,193 $ 22,074