Answered step by step
Verified Expert Solution
Link Copied!

Question

1 Approved Answer

Min. Ist Qu. Median Mean 3rd Qu. Max . 0.00 0.00 5.00 14.77 20.00 208.00 Min. ist Qu. Median Mean ard Qu. Max . 0.000
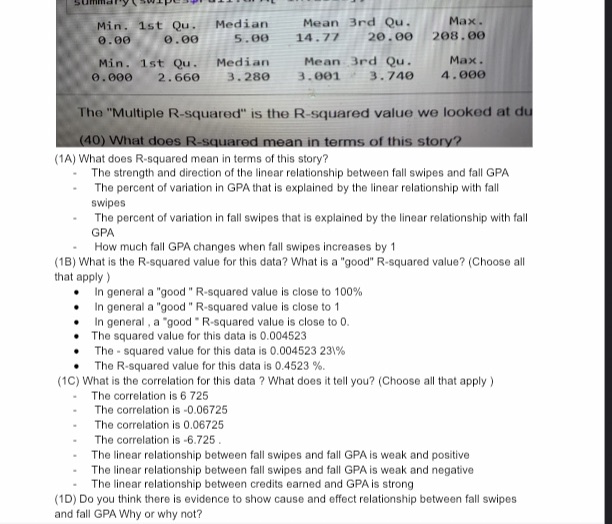
image text in transcribed
Min. Ist Qu. Median Mean 3rd Qu. Max . 0.00 0.00 5.00 14.77 20.00 208.00 Min. ist Qu. Median Mean ard Qu. Max . 0.000 2. 660 3. 280 3.001 . 3.740 4.000 The "Multiple R-squared" is the R-squared value we looked at du (40) What does R-squared mean in terms of this story? (1A) What does R-squared mean in terms of this story? The strength and direction of the linear relationship between fall swipes and fall GPA The percent of variation in GPA that is explained by the linear relationship with fall swipes The percent of variation in fall swipes that is explained by the linear relationship with fall GPA How much fall GPA changes when fall swipes increases by 1 (18) What is the R-squared value for this data? What is a "good" R-squared value? (Choose all that apply ) In general a "good " R-squared value is close to 100% In general a "good " R-squared value is close to 1 In general , a "good " R-squared value is close to 0. The squared value for this data is 0.004523 The - squared value for this data is 0.004523 231% The R-squared value for this data is 0.4523 %. (1C) What is the correlation for this data ? What does it tell you? (Choose all that apply ) The correlation is 6 725 The correlation is -0.06725 The correlation is 0.06725 The correlation is -6.725 . The linear relationship between fall swipes and fall GPA is weak and positive The linear relationship between fall swipes and fall GPA is weak and negative The linear relationship between credits earned and GPA is strong (1D) Do you think there is evidence to show cause and effect relationship between fall swipes and fall GPA Why or why not

Step by Step Solution

There are 3 Steps involved in it

Step: 1

blur-text-image

Get Instant Access to Expert-Tailored Solutions

See step-by-step solutions with expert insights and AI powered tools for academic success

Step: 2

blur-text-image_2

Step: 3

blur-text-image_3

Ace Your Homework with AI

Get the answers you need in no time with our AI-driven, step-by-step assistance

Get Started

Recommended Textbook for

Precalculus Enhanced With Graphing Utilities (Subscription)

Authors: Michael, Michael Sullivan III, Michael III Sullivan, III Sullivan

6th Edition

0321849108, 9780321849106

More Books

Students also viewed these Mathematics questions

Question

broker contract south carolina

Answered: 1 week ago

Question

using signal flow graph

Answered: 1 week ago