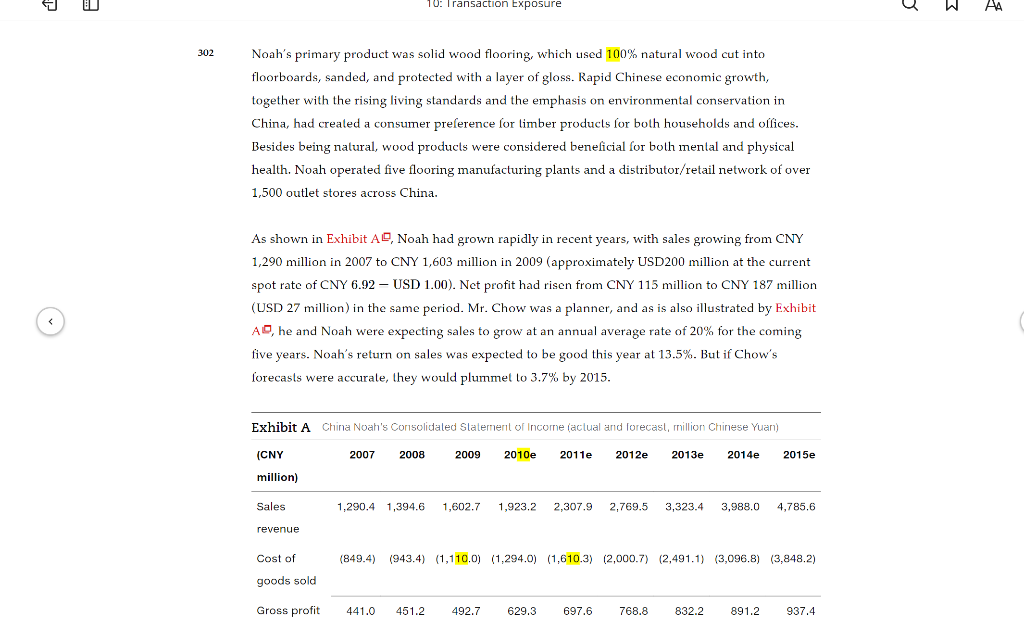
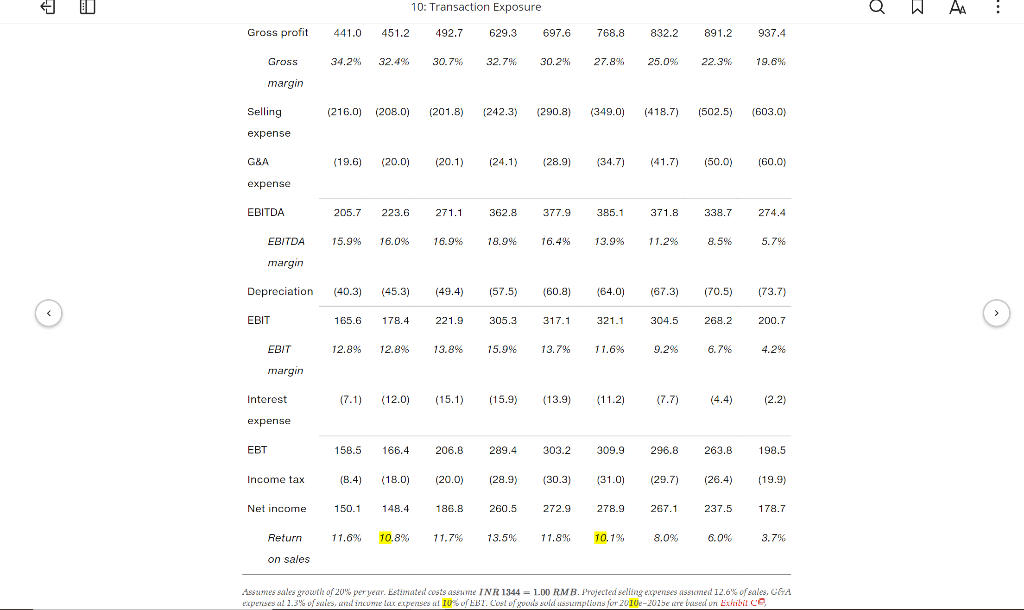
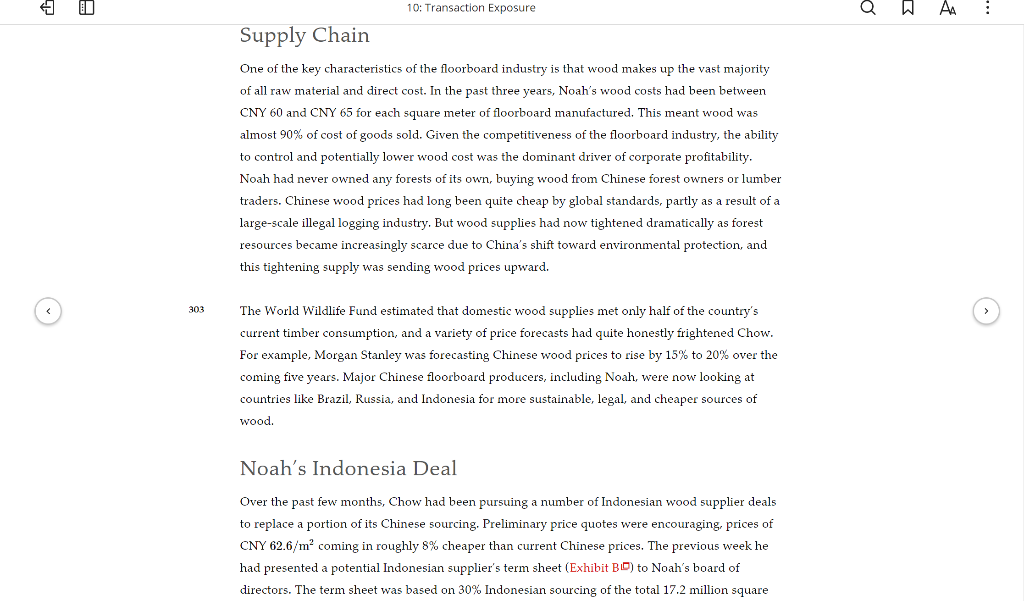
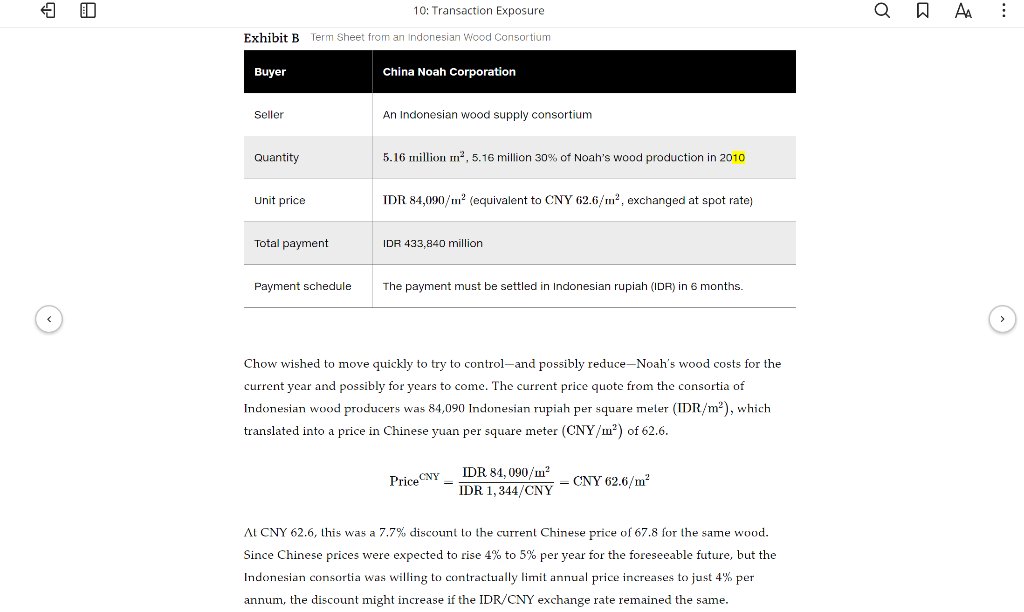
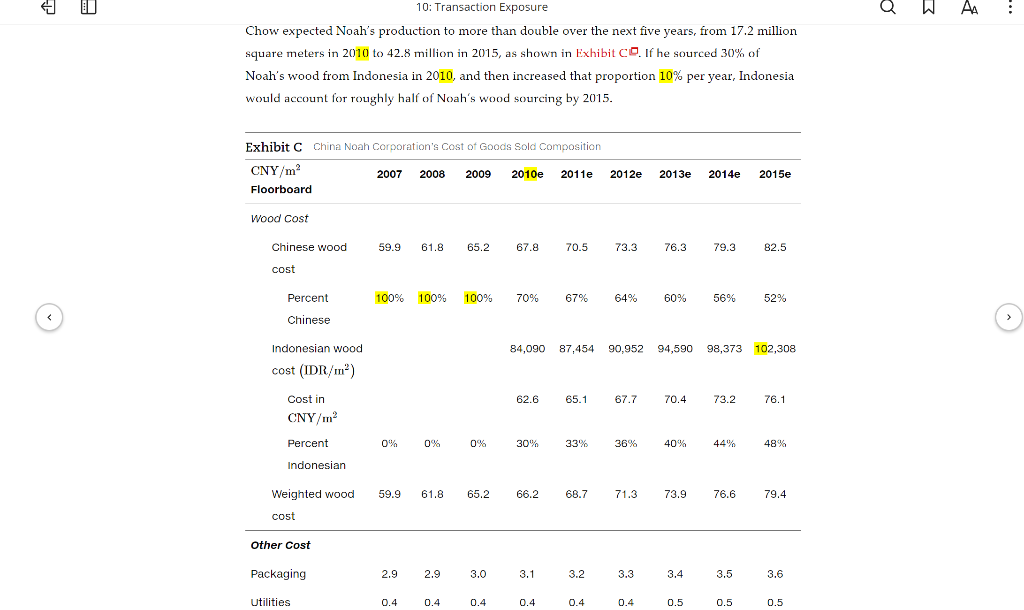
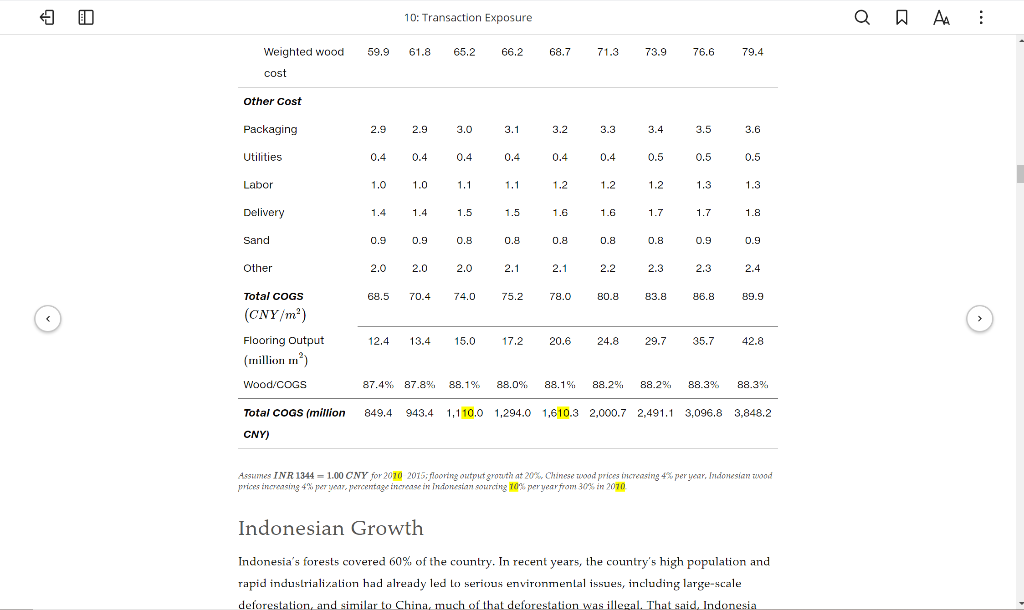
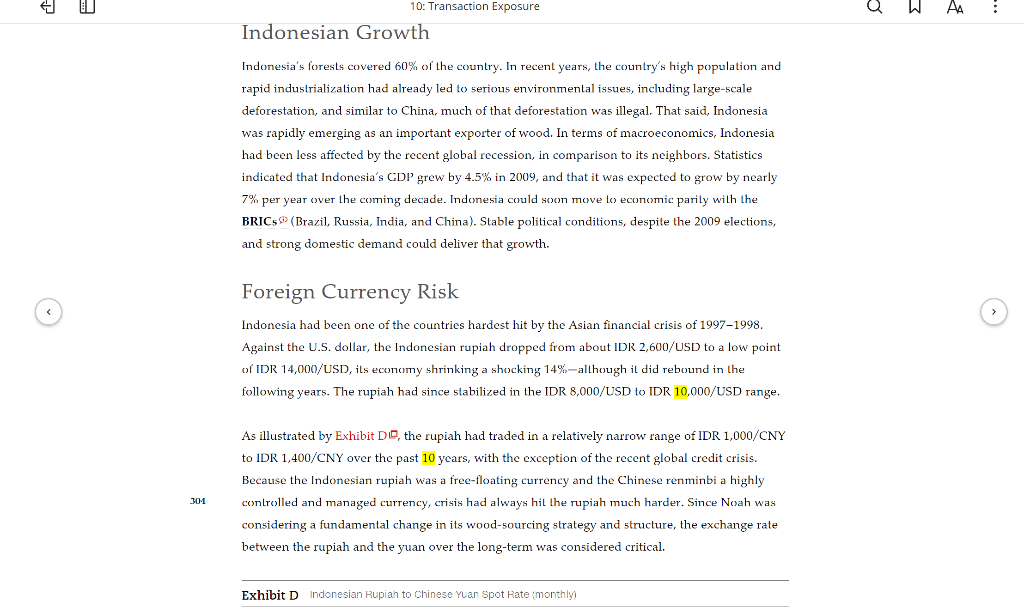
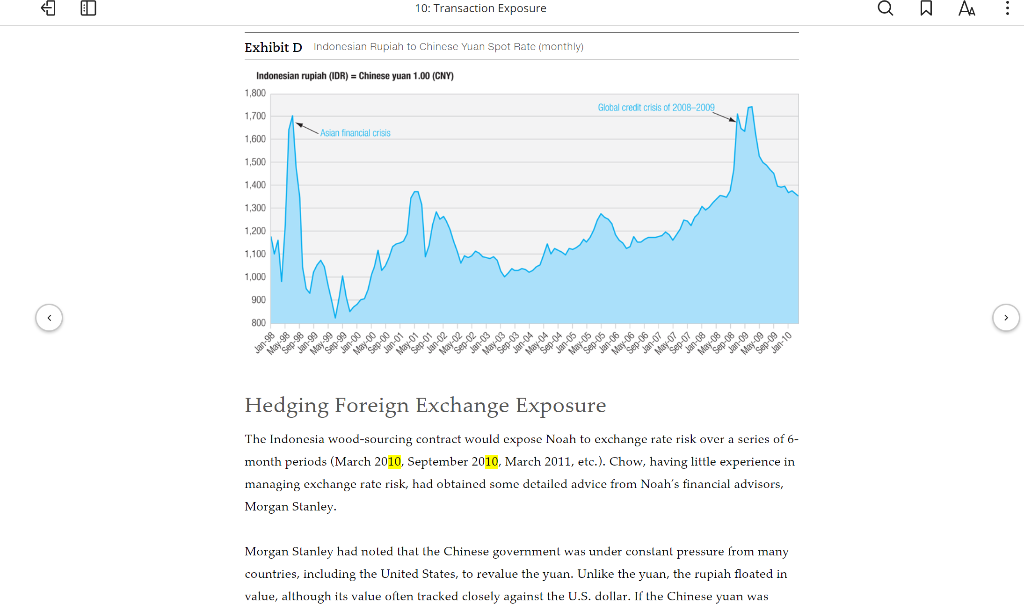
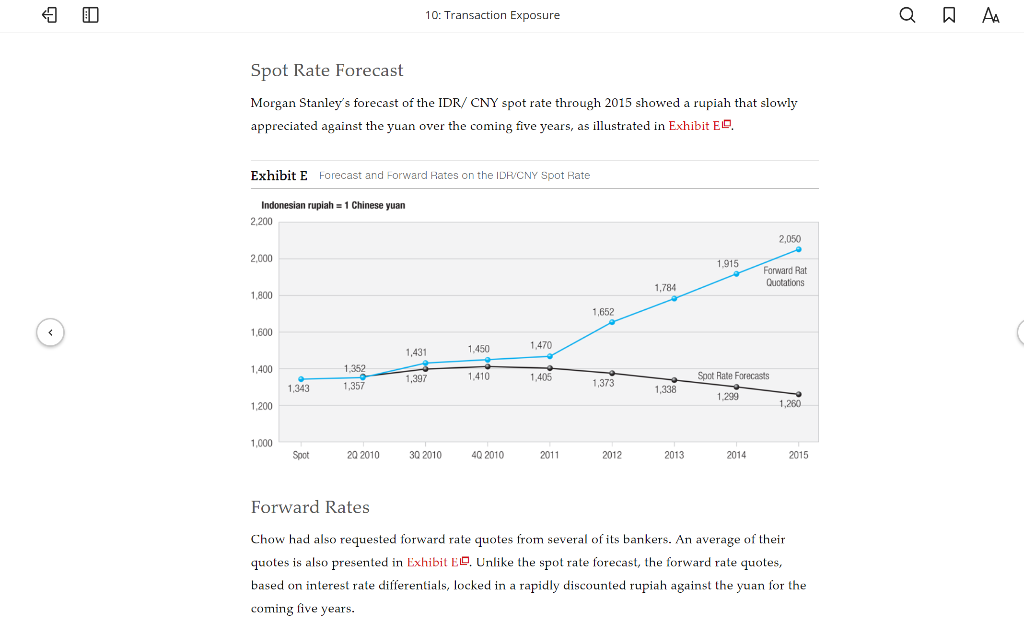
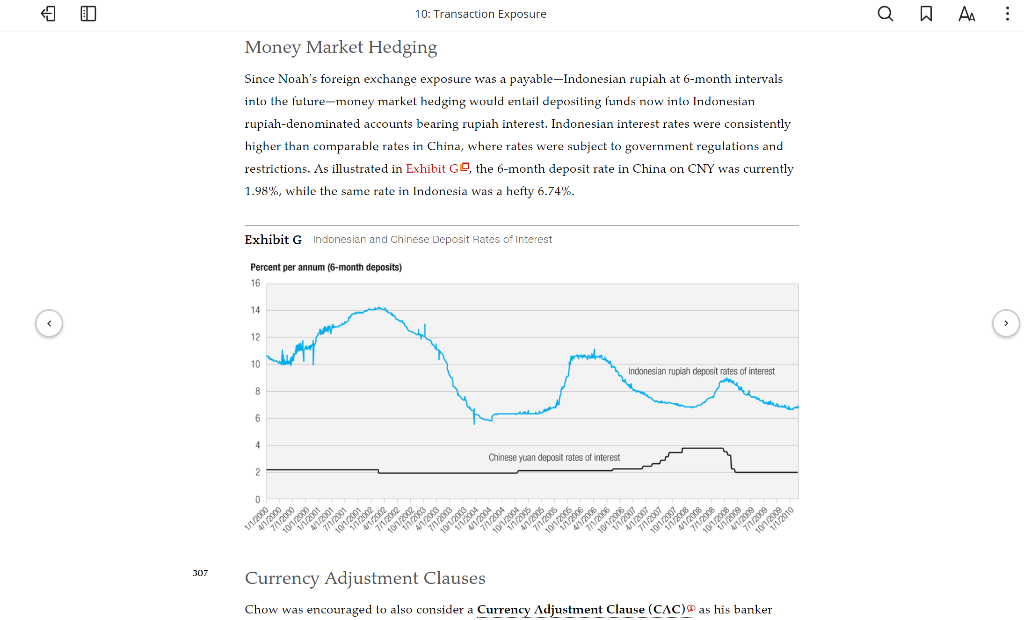
Mini-Case China Noah Corporation China's voracious consumer appetites are already reaching into every corner of Indonesia. The increasing weight of China in every market is a global trend, but growing Chinese, as well as Indian, demand is making an especially big impact in Indonesia. Nick Cashmore of the Jakarta office of CLSA, an investment bank, has coined a new term to describe this symbiotic relationship: "Chindonesia. - "Special Repual uri indurresia: Mure Thun a Single Swallow, The Economist, Seplenben 10, 2009. In early 2010, Mr. Savio Chow, CFO of China Noah Corporation (Noah), was concerned about the foreign exchange exposure his company could be creating by shifting much of its procurement of wood to Indonesia. Noah was a leading floorboard manufacturer in China that purchased more than USD 100 million in lumber annually, primarily from local wood suppliers in China. But now Mr. Chow planned to shift a large portion of his raw material procurement to Indonesian suppliers in light of the abundant wood resources in Indonesia and the increasingly tight wood supply market in China. Chow knew he needed an explicit strategy for managing the currency exposure. China Noah Noah, a private company owned by its founding family, was one of the largest floorboard producers in China. The company was established in 1982 by the current chairman, Mr. Se Hok Pan, a Macau resident. Most of the company's senior management team had been with the company since inception. 302 Noah's primary product was solid wood flooring, which used 100% natural wood cut into 4 U 10: Transaction Exposure u AA 302 Noah's primary product was solid wood flooring, which used 100% natural wood cut into floorboards, sanded, and protected with a layer of gloss. Rapid Chinese economic growth, together with the rising living standards and the emphasis on environmental conservation in China, had created a consumer preference for limber products for both households and offices. Besides being natural, wood products were considered beneficial for both mental and physical health. Noah operated five flooring manufacturing plants and a distributor/retail network of over 1,500 outlet stores across China. As shown in Exhibit AC, Noah had grown rapidly in recent years, with sales growing from CNY 1,290 million in 2007 to CNY 1,603 million in 2009 (approximately USD200 million at the current spot rate of CNY 6.92 - USD 1.00). Net profit had risen from CNY 115 million to CNY 187 million (USD 27 million) in the same period. Mr. Chow was a planner, and as is also illustrated by Exhibit A, he and Noah were expecting sales to grow at an annual average rate of 20% for the coming five years. Noah's return on sales was expected to be good this year at 13.5%. But if Chow's forecasts were accurate, they would plummet to 3.7% by 2015. Exhibit A China Noah's Consolidaled Statement of Income (actual and forecast, million Chinese Yuan) (CNY 2007 2008 2009 2010e 2011e 2012e 2013e 2014e 2015e million) Sales 1,290.4 1,394.6 1,602.7 1,923.2 2,307.9 2,769.5 3,323.4 3,988.0 4,785.6 revenue Cost of (849.4) (943.4) (1,110.0) (1,294.0) (1,610.3) (2,000.7) (2,491.1) (3,096.8) (3,848.2) goods sold Gross profit 441.0 451.2 492.7 629.3 697.6 768.8 832.2 891.2 937.4 10: Transaction Exposure AA Gross profit 441.0 451.2 492.7 629.3 697.6 768.8 832.2 891.2 937.4 Gross 34.2% 32.4% 30.79 32.7% 30.2% 27.8% 25.0% 22.3% 19.6% margin Selling (216.0) (208.0) (201.8) (242.3) (290.8) (349.0) (418.7) (502.5) (603.0) expense G&A (19.6) (20.0) (20.1) (24.1) (28.9) (34.7) (41.7) (50.0) (60.0) expense EBITDA 205.7 223.6 271.1 362.8 377.9 385.1 371.8 338.7 274.4 EBITDA 15.9% 16.09 16.9% 18.9% 16.4% 13.9% 11.29 8.5% 5.7% margin Depreciation (40.3) (45.3) (49.4) (57.5) (60.8) (64.0) (67.3) (70.5) (73.7) EBIT 165.6 178.4 221.9 305.3 317.1 321.1 304.5 268.2 200.7 EBIT 12.896 12.896 13.8% 15.9% 13.7% 1 1.6% 9.29 6.7% 4.2% margin Interest (12.0) (15.1) (15.9) (13.9) (11.2) (4.4) (2.2) expense EBT 158.5 166.4 206.8 289,4 303.2 309.9 296.8 263.8 198.5 Income tax (8.4) (18.0) (20.0) (28.9) (30.3) (31.0) (29.7) (26.4) (19.9) Net income 150.1 148.4 186.8 260.5 272.9 278.9 267.1 237.5 178.7 Return 11.6% 10.8% 11.7% 13.5% 11.8% 10.1% 8.0% 6.0% % 3.7% on sales Assumes sales growth of 20% per year. Estimated costs assume INR 1344 = 1.00 RMB. Projected selling expenses assiemed 12.6% of sales, C&A expenses at 1.3% of sales, cred income tax expenses al 10% of EBT. Cost of guous sold assumplions for 2010e-2015e are based on Exhibit ce 10: Transaction Exposure Q AM Supply Chain One of the key characteristics of the floorboard industry is that wood makes up the vast majority of all raw material and direct cost. In the past three years, Noah's wood costs had been between CNY 60 and CNY 65 for each square meter of floorboard manufactured. This meant wood was almost 90% of cost of goods sold. Given the competitiveness of the floorboard industry, the ability to control and potentially lower wood cost was the dominant driver of corporate profitability. Noah had never owned any forests of its own, buying wood from Chinese forest owners or lumber traders. Chinese wood prices had long been quite cheap by global standards, partly as a result of a large-scale illegal logging industry. But wood supplies had now tightened dramatically as forest resources became increasingly scarce due to China's shift toward environmental protection, and this tightening supply was sending wood prices upward. 303 The World Wildlife Fund estimated that domestic wood supplies met only half of the country's current timber consumption, and a variety of price forecasts had quite honestly frightened Chow. For example, Morgan Stanley was forecasting Chinese wood prices to rise by 15% to 20% over the coming five years. Major Chinese floorboard producers, including Noah, were now looking at countries like Brazil, Russia, and Indonesia for more sustainable, legal, and cheaper sources of wood. Noah's Indonesia Deal Over the past few months, Chow had been pursuing a number of Indonesian wood supplier deals to replace a portion of its Chinese sourcing. Preliminary price quotes were encouraging prices of CNY 62.6/m coming in roughly 8% cheaper than current Chinese prices. The previous week he had presented a potential Indonesian supplier's term sheet (Exhibit BD) to Noah's board of directors. The term sheet was based on 30% Indonesian sourcing of the total 17.2 million square 10: Transaction Exposure QAAA Exhibit B Term Sheet from an Indonesian Wood Consortium Buyer China Noah Corporation Seller An Indonesian wood supply consortium Quantity 5.16 million ma, 5.16 million 30% of Noah's wood production in 2010 Unit price IDR 84,090/m (equivalent to CNY 62.6/m, exchanged at spot rate) Total payment IDR 433,840 million Payment schedule The payment must be settled in Indonesian rupiah (IDR) in 6 months. Chow wished to move quickly to try to control-and possibly reduce-Noah's wood costs for the current year and possibly for years to come. The current price quote from the consortia of Indonesian wood producers was 84,090 Indonesian rupiah per square meter (IDR/m), which translated into a price in Chinese yuan per square meter (CNY/m) of 62.6. Price CNY IDR 84,090/mp = CNY 62.6/m IDR 1,344/CNY At CNY 62.6, this was a 7.7% discount to the current Chinese price of 67.8 for the same wood. Since Chinese prices were expected to rise 4% to 5% per year for the foreseeable future, but the Indonesian consortia was willing to contractually limit annual price increases to just 4% per annum, the discount might increase if the IDR/CNY exchange rate remained the same. Q AA 10: Transaction Exposure Chow expected Noah's production to more than double over the next five years, from 17.2 million square meters in 2010 to 42.8 million in 2015, as shown in Exhibit CO. If he sourced 30% of Noah's wood from Indonesia in 2010, and then increased that proportion 10% per year, Indonesia would account for roughly half of Noah's wood sourcing by 2015. Exhibit C China Noah Corporation's Cost of Goods Sold Composition CNY/m 2007 2008 2009 2010e 2011e Floorboard 2012e 2013e 2014e 2015e Wood Cost Chinese wood 59.9 61.8 65.2 67.8 70.5 73.3 76.3 79.3 82.5 cost Percent 100% 100% 100% 100% 70% 67% 64% 60% 56% 52%


