Question
Mission: One theory is that a vitamin C treatment over several weeks will cure the virus. You investigate this by measuring symptom severity (on a
Mission: One theory is that a vitamin C treatment over several weeks will cure the virus. You investigate this by measuring symptom severity (on a scale from 1 to 10) of a group of patients. The group is given a vitamin C treatment, and you measure symptom severity before treatment and at one week intervals for three weeks.
Your question: Does using vitamin C affect the symptom severity of patients with the virus? Is there a change in symptom severity from before to week 1 to week 2 to week 3?
Independent Variable:
DependentVariable:
2. Calculate the mean symptom severity score for each week. [Round your answers to one decimal place.]
Before:
Week1:
Week2:
Week3 :
Use the SPSS output to answer the following questions.
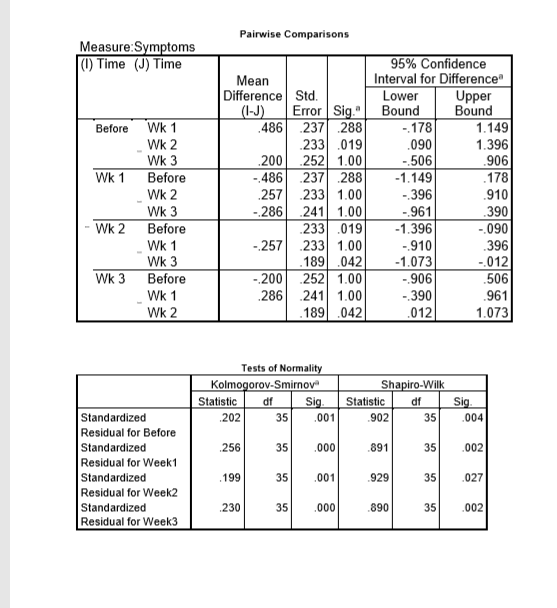
3. Report the appropriate p-values for testing the assumption of normality. [Do not round the values from the table.]
Before:
Week1:
Week2:
Week3 :
4. Can normality be assumed?
Regardless of the results to question 3, continue with the analysis
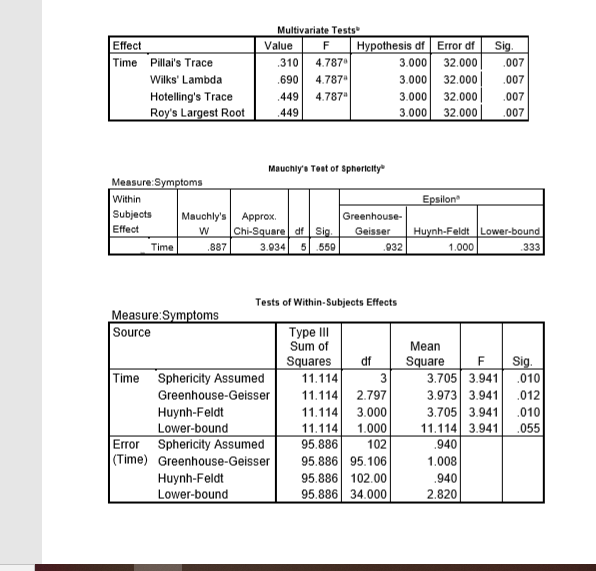
5. Report the appropriate test statistic and p-value to test the assumption of sphericity. [Do not round the values from the table.]
Test statistic:
p-value:
6. Report the appropriate test statistic, p-value, and degrees of freedom that answer the question. [Do not round the values from the table.]
Test Statistic:
P-value:
Df:
7. If appropriate, use post hoc tests to determine if there is a change in symptom severity over time.
DATA
Column A
ID 1 2 3 4 5 6 7 8 9 10 11 12 13 14 15 16 17 18 19 20 21 22 23 24 25 26 27 28 29 30 31 32 33 34 35
column B
Before 7 7 4 6 6 6 6 7 6 6 6 6 6 6 6 5 5 6 7 5 5 7 7 5 6 6 7 6 7 5 5 6 8 5 6
column C
Week1 7 8 5 8 8 7 6 7 6 8 8 8 9 8 9 8 8 8 8 8 9 9 7 9 9 9 7 6 7 9 9 9 9 7 9
column D
Week2 4 6 4 6 5 7 6 3 6 5 6 6 6 5 5 4 7 8 4 4 5 5 5 5 5 4 4 5 7 4 3 4 6 5 5
column E
Week3 9 8 12 9 9 9 8 8 8 9 9 10 8 7 7 9 7 8 8 10 7 9 8 9 9 10 8 9 8 7 7 8 9 8 10


Step by Step Solution
There are 3 Steps involved in it
Step: 1

Get Instant Access to Expert-Tailored Solutions
See step-by-step solutions with expert insights and AI powered tools for academic success
Step: 2

Step: 3

Ace Your Homework with AI
Get the answers you need in no time with our AI-driven, step-by-step assistance
Get Started


