Answered step by step
Verified Expert Solution
Question
1 Approved Answer
(Misusing the percent of sales method) The Caraway Seed Company has grown rapidly over the last decade and is trying to forecast the firm's

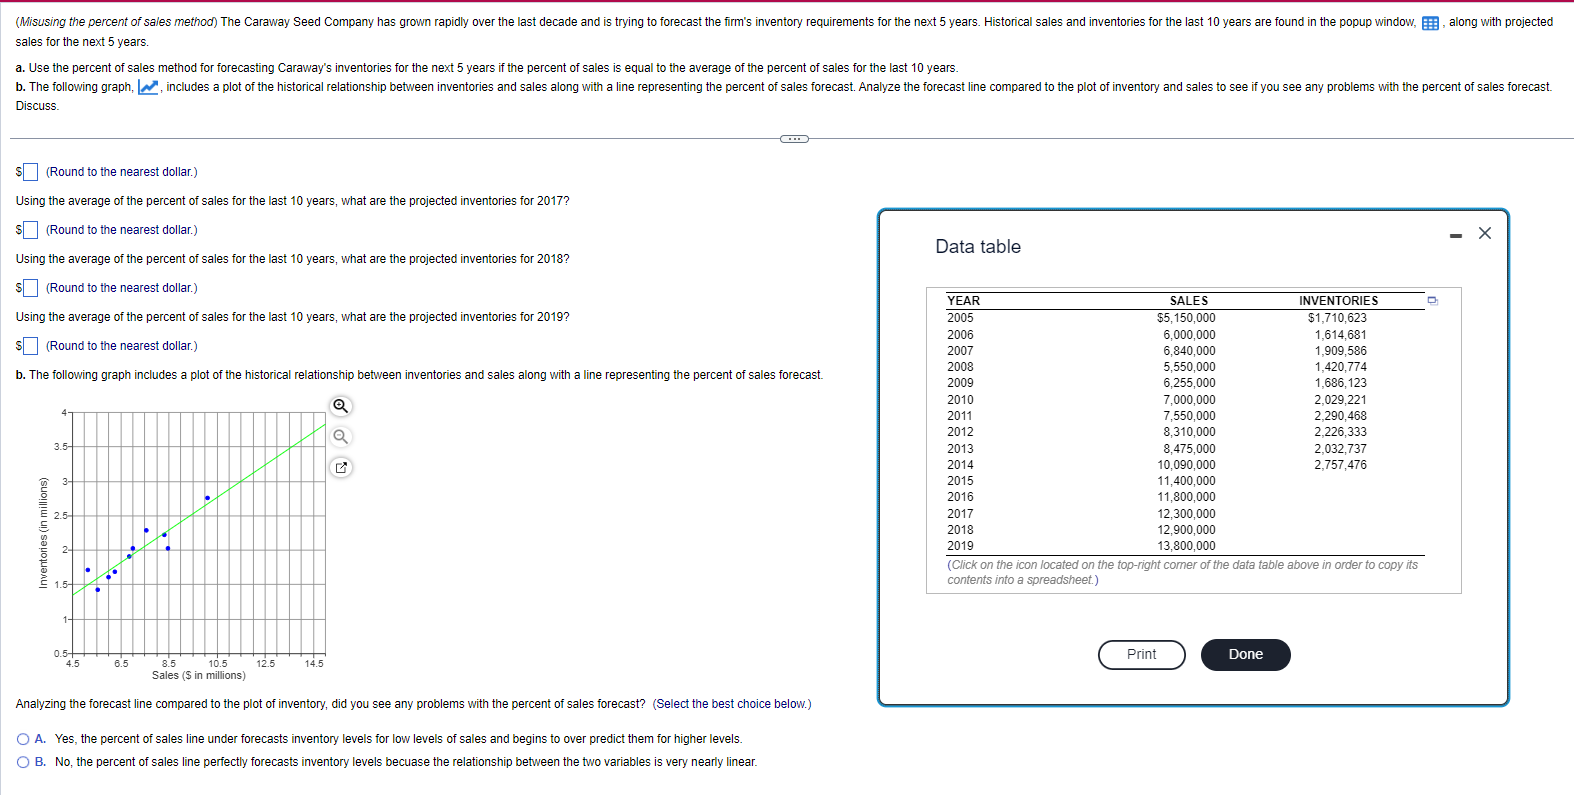
(Misusing the percent of sales method) The Caraway Seed Company has grown rapidly over the last decade and is trying to forecast the firm's inventory requirements for the next 5 years. Historical sales and inventories for the last 10 years are found in the popup window, sales for the next 5 years. a. Use the percent of sales method for forecasting Caraway's inventories for the next 5 years if the percent of sales is equal to the average of the percent of sales for the last 10 years. b. The following graph, Discuss. along with projected , includes a plot of the historical relationship between inventories and sales along with a line representing the percent of sales forecast. Analyze the forecast line compared to the plot of inventory and sales to see if you see any problems with the percent of sales forecast. (Round to the nearest dollar.) Using the average of the percent of sales for the last 10 years, what are the projected inventories for 2017? (Round to the nearest dollar.) Using the average of the percent of sales for the last 10 years, what are the projected inventories for 2018? (Round to the nearest dollar.) Data table YEAR Using the average of the percent of sales for the last 10 years, what are the projected inventories for 2019? 2005 SALES $5,150,000 INVENTORIES 2006 6,000,000 $1,710,623 1,614,681 (Round to the nearest dollar.) 2007 6,840,000 1,909,586 b. The following graph includes a plot of the historical relationship between inventories and sales along with a line representing the percent of sales forecast. Q 2008 5,550,000 1,420,774 2009 6,255,000 1,686,123 2010 7,000,000 2,029,221 2011 7,550,000 2,290,468 2012 8,310,000 2,226,333 3.5- 2013 8,475,000 2,032,737 2014 10,090,000 2,757,476 Inventories (in millions) 2015 11,400,000 2016 11,800,000 2.5- 2017 12,300,000 2018 12,900,000 2019 13,800,000 1.5- (Click on the icon located on the top-right corner of the data table above in order to copy its contents into a spreadsheet.) 1- 0.5+ 4.5 6.5 8.5 10.5 12.5 14.5 Sales ($ in millions) Analyzing the forecast line compared to the plot of inventory, did you see any problems with the percent of sales forecast? (Select the best choice below.) A. Yes, the percent of sales line under forecasts inventory levels for low levels of sales and begins to over predict them for higher levels. B. No, the percent of sales line perfectly forecasts inventory levels becuase the relationship between the two variables is very nearly linear. Print Done
Step by Step Solution
There are 3 Steps involved in it
Step: 1

Get Instant Access to Expert-Tailored Solutions
See step-by-step solutions with expert insights and AI powered tools for academic success
Step: 2

Step: 3

Ace Your Homework with AI
Get the answers you need in no time with our AI-driven, step-by-step assistance
Get Started


