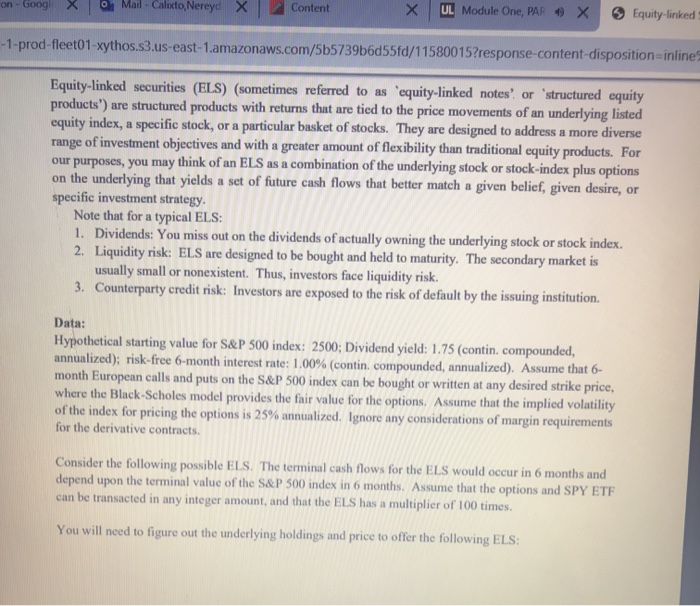
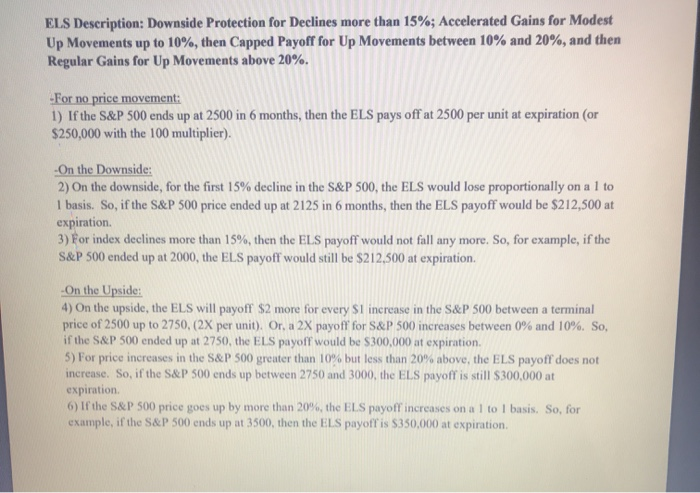
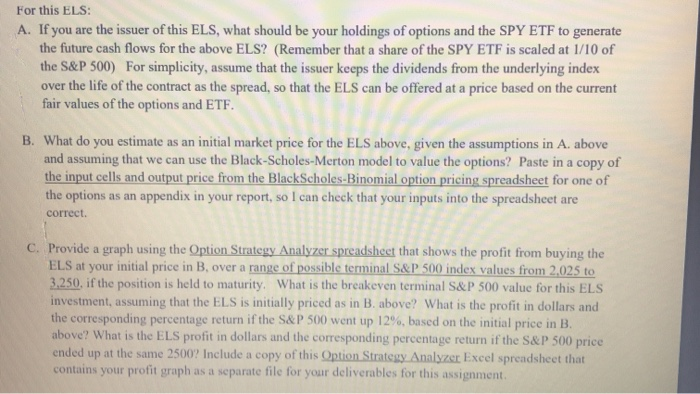
* MitalistaNereya X Content X UL Module One, PAR X Equity linked 1-prod-fleet01-xythos.s3.us-east-1.amazonaws.com/5b5739b6d55fd/11580015?response-content-disposition=inline Equity-linked securities (ELS) (sometimes referred to as 'equity-linked notes' or 'structured equity products") are structured products with returns that are tied to the price movements of an underlying listed equity index, a specific stock, or a particular basket of stocks. They are designed to address a more diverse range of investment objectives and with a greater amount of flexibility than traditional equity products. For our purposes, you may think of an ELS as a combination of the underlying stock or stock-index plus options on the underlying that yields a set of future cash flows that better match a given belief, given desire, or specific investment strategy. Note that for a typical ELS: 1. Dividends: You miss out on the dividends of actually owning the underlying stock or stock index. 2. Liquidity risk: ELS are designed to be bought and held to maturity. The secondary market is usually small or nonexistent. Thus, investors face liquidity risk. 3. Counterparty credit risk: Investors are exposed to the risk of default by the issuing institution. Data: Hypothetical starting value for S&P 500 index: 2500; Dividend yield: 1.75 (contin compounded, annualized); risk-free 6-month interest rate: 1.00% (contin. compounded, annualized). Assume that 6- month European calls and puts on the S&P 500 index can be bought or written at any desired strike price, where the Black-Scholes model provides the fair value for the options. Assume that the implied volatility of the index for pricing the options is 25% annualized. Ignore any considerations of margin requirements for the derivative contracts. Consider the following possible ELS. The terminal cash flows for the ELS would occur in 6 months and depend upon the terminal value of the S&P 500 index in 6 months. Assume that the options and SPY ETF can be transacted in any integer amount, and that the ELS has a multiplier of 100 times. You will need to figure out the underlying holdings and price to offer the following ELS: ELS Description: Downside Protection for Declines more than 15%; Accelerated Gains for Modest Up Movements up to 10%, then Capped Payoff for Up Movements between 10% and 20%, and then Regular Gains for Up Movements above 20%. -For no price movement: 1) If the S&P 500 ends up at 2500 in 6 months, then the ELS pays off at 2500 per unit at expiration (or $250,000 with the 100 multiplier). -On the Downside: 2) On the downside, for the first 15% decline in the S&P 500, the ELS would lose proportionally on a 1 to 1 basis. So, if the S&P 500 price ended up at 2125 in 6 months, then the ELS payoff would be $212,500 at expiration 3) For index declines more than 15%, then the ELS payoff would not fall any more. So, for example, if the S&P 500 ended up at 2000, the ELS payoff would still be $212,500 at expiration -On the Upside: 4) On the upside, the ELS will payoff $2 more for every S1 increase in the S&P 500 between a terminal price of 2500 up to 2750, (2X per unit). Or, a 2X payoff for S&P 500 increases between 0% and 10%. So, if the S&P 500 ended up at 2750, the ELS payoff would be $300,000 at expiration. 5) For price increases in the S&P 500 greater than 10% but less than 20% above, the ELS payoff does not increase. So, if the S&P 500 ends up between 2750 and 3000, the ELS payoff is still $300,000 at expiration 6) If the S&P 500 price goes up by more than 20%, the ELS payoff increases on a l to l basis. So, for example, if the S&P 500 ends up at 3500, then the ELS payoff is $350,000 at expiration For this ELS: A. If you are the issuer of this ELS, what should be your holdings of options and the SPY ETF to generate the future cash flows for the above ELS? (Remember that a share of the SPY ETF is scaled at 1/10 of the S&P 500) For simplicity, assume that the issuer keeps the dividends from the underlying index over the life of the contract as the spread, so that the ELS can be offered at a price based on the current fair values of the options and ETF. B. What do you estimate as an initial market price for the ELS above, given the assumptions in A. above and assuming that we can use the Black-Scholes-Merton model to value the options? Paste in a copy of the input cells and output price from the BlackScholes-Binomial option pricing spreadsheet for one of the options as an appendix in your report, so I can check that your inputs into the spreadsheet are correct C. Provide a graph using the Option Strategy Analyzer spreadsheet that shows the profit from buying the ELS at your initial price in B, over a range of possible terminal S&P 500 index values from 2,025 to 3.250, if the position is held to maturity. What is the breakeven terminal S&P 500 value for this ELS investment, assuming that the ELS is initially priced as in B. above? What is the profit in dollars and the corresponding percentage return if the S&P 500 went up 12%, based on the initial price in B. above? What is the ELS profit in dollars and the corresponding percentage return if the S&P 500 price ended up at the same 2500? Include a copy of this Option Strategy Analyzer Excel spreadsheet that contains your profit graph as a separate file for your deliverables for this assignment * MitalistaNereya X Content X UL Module One, PAR X Equity linked 1-prod-fleet01-xythos.s3.us-east-1.amazonaws.com/5b5739b6d55fd/11580015?response-content-disposition=inline Equity-linked securities (ELS) (sometimes referred to as 'equity-linked notes' or 'structured equity products") are structured products with returns that are tied to the price movements of an underlying listed equity index, a specific stock, or a particular basket of stocks. They are designed to address a more diverse range of investment objectives and with a greater amount of flexibility than traditional equity products. For our purposes, you may think of an ELS as a combination of the underlying stock or stock-index plus options on the underlying that yields a set of future cash flows that better match a given belief, given desire, or specific investment strategy. Note that for a typical ELS: 1. Dividends: You miss out on the dividends of actually owning the underlying stock or stock index. 2. Liquidity risk: ELS are designed to be bought and held to maturity. The secondary market is usually small or nonexistent. Thus, investors face liquidity risk. 3. Counterparty credit risk: Investors are exposed to the risk of default by the issuing institution. Data: Hypothetical starting value for S&P 500 index: 2500; Dividend yield: 1.75 (contin compounded, annualized); risk-free 6-month interest rate: 1.00% (contin. compounded, annualized). Assume that 6- month European calls and puts on the S&P 500 index can be bought or written at any desired strike price, where the Black-Scholes model provides the fair value for the options. Assume that the implied volatility of the index for pricing the options is 25% annualized. Ignore any considerations of margin requirements for the derivative contracts. Consider the following possible ELS. The terminal cash flows for the ELS would occur in 6 months and depend upon the terminal value of the S&P 500 index in 6 months. Assume that the options and SPY ETF can be transacted in any integer amount, and that the ELS has a multiplier of 100 times. You will need to figure out the underlying holdings and price to offer the following ELS: ELS Description: Downside Protection for Declines more than 15%; Accelerated Gains for Modest Up Movements up to 10%, then Capped Payoff for Up Movements between 10% and 20%, and then Regular Gains for Up Movements above 20%. -For no price movement: 1) If the S&P 500 ends up at 2500 in 6 months, then the ELS pays off at 2500 per unit at expiration (or $250,000 with the 100 multiplier). -On the Downside: 2) On the downside, for the first 15% decline in the S&P 500, the ELS would lose proportionally on a 1 to 1 basis. So, if the S&P 500 price ended up at 2125 in 6 months, then the ELS payoff would be $212,500 at expiration 3) For index declines more than 15%, then the ELS payoff would not fall any more. So, for example, if the S&P 500 ended up at 2000, the ELS payoff would still be $212,500 at expiration -On the Upside: 4) On the upside, the ELS will payoff $2 more for every S1 increase in the S&P 500 between a terminal price of 2500 up to 2750, (2X per unit). Or, a 2X payoff for S&P 500 increases between 0% and 10%. So, if the S&P 500 ended up at 2750, the ELS payoff would be $300,000 at expiration. 5) For price increases in the S&P 500 greater than 10% but less than 20% above, the ELS payoff does not increase. So, if the S&P 500 ends up between 2750 and 3000, the ELS payoff is still $300,000 at expiration 6) If the S&P 500 price goes up by more than 20%, the ELS payoff increases on a l to l basis. So, for example, if the S&P 500 ends up at 3500, then the ELS payoff is $350,000 at expiration For this ELS: A. If you are the issuer of this ELS, what should be your holdings of options and the SPY ETF to generate the future cash flows for the above ELS? (Remember that a share of the SPY ETF is scaled at 1/10 of the S&P 500) For simplicity, assume that the issuer keeps the dividends from the underlying index over the life of the contract as the spread, so that the ELS can be offered at a price based on the current fair values of the options and ETF. B. What do you estimate as an initial market price for the ELS above, given the assumptions in A. above and assuming that we can use the Black-Scholes-Merton model to value the options? Paste in a copy of the input cells and output price from the BlackScholes-Binomial option pricing spreadsheet for one of the options as an appendix in your report, so I can check that your inputs into the spreadsheet are correct C. Provide a graph using the Option Strategy Analyzer spreadsheet that shows the profit from buying the ELS at your initial price in B, over a range of possible terminal S&P 500 index values from 2,025 to 3.250, if the position is held to maturity. What is the breakeven terminal S&P 500 value for this ELS investment, assuming that the ELS is initially priced as in B. above? What is the profit in dollars and the corresponding percentage return if the S&P 500 went up 12%, based on the initial price in B. above? What is the ELS profit in dollars and the corresponding percentage return if the S&P 500 price ended up at the same 2500? Include a copy of this Option Strategy Analyzer Excel spreadsheet that contains your profit graph as a separate file for your deliverables for this assignment