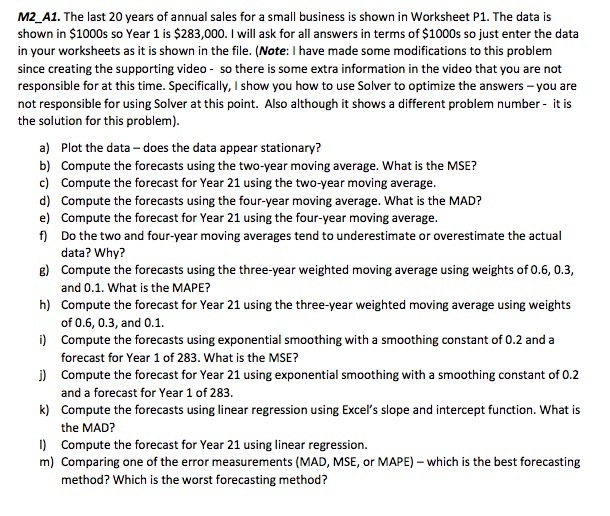
MLAI. The last 2D years of annual sales for a small business is shown in Worltsheet P1. The data Is shown in Slums so 1rear 1 is $233,!Iin. I will aslt for all answers in terms of Slums so just enter the data in your worksheets as it is shown in the file. More: I have made some modifications to this problem since creating the supporting video - so there Is some extra information in the video that you are not responsible for at this time. Specically, I show you how to use Solver to optimize the answers -you are not responsible for using Solver at this point. Also although it shows a different problem number - it is the solution for this problem]. a} Plot the data - does the data appear stationary? Compute the forecasts using the two-year moving average. What is the MSE? Compute the forecast for 'r'ear 21 using the two-year moving average. Compute the forecasts using the fouryear moving average. What is the MAD? Compute the forecast for 'r'ear 21 using the four-year moving average. Do the two and four-year moving averages tend to underestimate or overestimate the actual data? Why? Compute the forecasts using the three-year weighted moving average using weights of I15; I13, and o_1_ What is the MAPE? Compute the forecast for 'r'ear 21 using the three-year weighted moving average using weights of, us, and o.1. Compute the forecasts using exponential smoothing with a smoothing constant of 111.2 and a forecast for \"fear 1 of 233. What is the MEE? Compute the forecast for \"rear 21 using exponential smoothing with a smoothing oonstant of I12 and a forecast for \"rear 1 of 233. Compute the forecasts using linear regression using Evcel's slope and intercept function. What is the MAD? Compute the forecast for 'r'ear 21 using linear regression. m} Comparing one of the error measurements (MAD; MSE, or MAPE} - which is the best forecasting method? Which Is the worst forecasting method