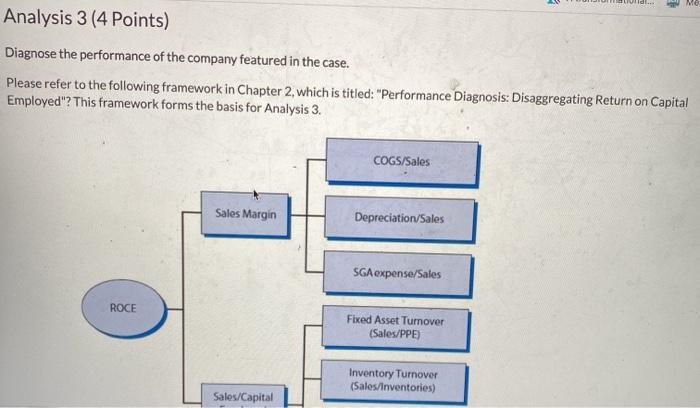
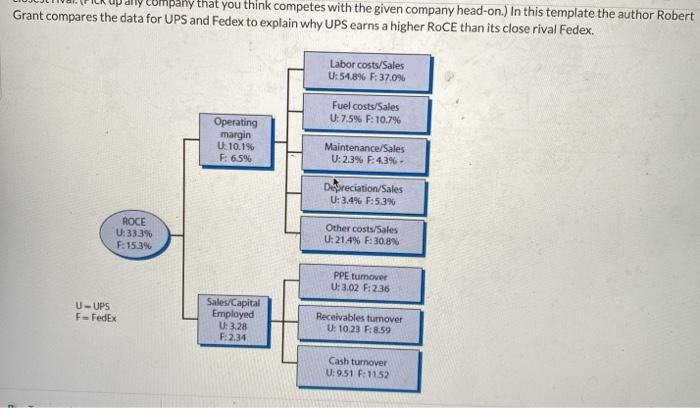
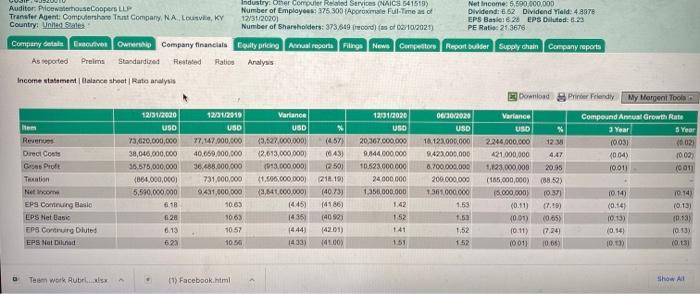
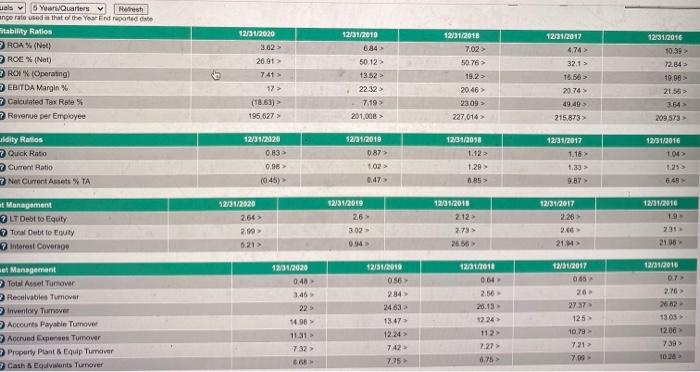
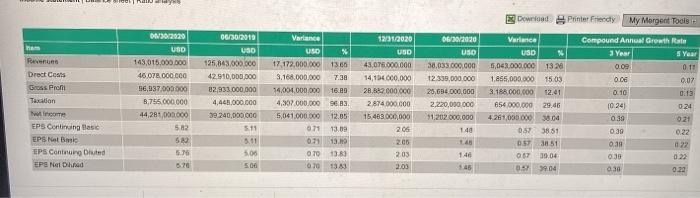
. MO Analysis 3 (4 Points) Diagnose the performance of the company featured in the case. Please refer to the following framework in Chapter 2, which is titled: "Performance Diagnosis: Disaggregating Return on Capital Employed"? This framework forms the basis for Analysis 3. COGS/Sales Sales Margin Depreciation Sales SGA expense/Sales ROCE Fixed Asset Turnover (Sales/PPE) Inventory Turnover (Sales/inventories) Sales/Capital You will calculate (or find) the firm's RoCE for at least three years. (You can calculate this from data obtained through Mergent online. Bloomberg provides this information for active companies.) You will then calculate other data points (i.e., Return on Sales, asset productivity, CoGS/ Sales, etc.). The idea is to diagnose the problem that is either currently confronting or might confront the given firm in the future. (What is point of this diagnosis?) This diagnosis helps companies take corrective action. For instance, the ROCE should ideally increase over the three year period. (I do not know but let us say that it did increase in the given company's case.) You will then diagnose which of the twp - Return on Sales or Asset productivity - contributed more to the growth in ROCE over the three year period. Let us say that the RoS declined while the asset productivity increased. This gives you a clue that the RoS is not going in the desired direction. You will then further disaggregate the RoS into various components to find out which of the components (or activities) are causing the problem. It is always better to simultaneously disaggregate RoS and Asset Productivity even if one of them does not seem problematic. THIS ANALYSIS IS WORTH 4 POINTS, Please understand that I cannot award you any points if I do not see at least a table of all calculations. I will award 2 out of four points for the calculations. The other two points are reserved for explaining the data. While I am asking you to disaggregate the RoCE into two components, another method referred to as the "Dupont formula breaks up the RoE into three components. (You can google out "Dupont Formula") I have attached an alternate template for cross-sectional analysis wherein you can compare the data for the given firm with its closest rival. (Pick up any company that you think competes with the given company head-on.) In this template the author Robert Grant compares the data for UPS and Fedex to explain why UPS earns a higher RoCE than its close rival Fedex ompany that you think competes with the given company head-on.) In this template the author Robert Grant compares the data for UPS and Fedex to explain why UPS earns a higher RoCE than its close rival Fedex. Labor costs/Sales U:54.8% :37,0% Fuel costs/Sales U: 7.5% -10,7% Operating margin U 10.19 F: 65% Maintenance/Sales U: 2.3% :4.3% Depreciation/Sales U: 3.4% F: 53% ROCE U:33.3% 1539 Other costs/Sales U:21.4% F: 30.8 PPE tumover U: 3.02 F: 2.36 U-UPS F-FedEx Sales/Capital Employed U: 328 F: 2.34 Receivables turnover U: 10.23 F: 8.59 Cash turnover U:951 F: 1152 Pricing Summary Michelle Browdy Senior Vice President, General Counsel Age 55 Salary 830,000 Time Period 1 week International Business Machines Corp. Price 1340 James Kavanaugh Senior Vice President, Chief Financial Officer Age 53 Salary 899,000 1335 1330 Share price (minon) 132.5- 1320- 1315- 1310 1305- 01/13/2021 04/15/2021 04/19/2021 2017/2021 Time Key Financials (In USD as of 12/31/2020) Income Statement Revenue 73,62m Net Income 5,590m EPS from Continuing Operations 6.13 EPS - Net Income. Dluted 623 Revenue per Share 82.46 Balance Sheet Total Assets 155,971m Total Liabilities 135,373m Shareholders' Equity 20,597m Total Assets per Share 174.73 Net Assets per Share 23.08 Cash Flows Cash from Operations 18.197m Cash from Investing -3,028 Cash from Financing -9,72m Capital Expenditures 2,618m Cash Flow per Share 20.30 52 Week Range 10665 136 38 Close Volume Yesterday 133.12 8,166 308.00 5 Days 132 58 3,883,596.00 30 Days 128.90 N/A 52 Week High/Low 136.38 - 106.65 3.57 % Price Change (100 Days) 200-Day Moving Avg. 123.95 Auditor PricewaterhouseCoopers LLP Industry.omer computer Reid Services NAICS $41519) Net Income: 5,590.000.000 Transfer Agent Completare Trust Company NALO, KY Number of Employees 376 300 Approximate Full-Time as of Dividend: 8.62 Dividend Yield: 48aTe 12/31/2020) EPS Basic: 628 EPS Diluted: 0.23 Country: United States Number of Shareholders: 373,619 records of 10/2023 PE Ratio 21 3676 Company details five ownership Company financials Boulty pricing Anal reportaling News Competitors Report builder supply chain Company reports As reported Preims Standardized Restated Ratios Analysis Income statementaleshootRate analysis Download Printer Friendly My target Tool 12/31/2000 12/31/2019 Variance 12191/2020 2020 Variance Compound Annual Growth Rate Nem USD USD USD % USO USD USD % 3 Year Year Revenons 73.620,000,000 77.147.000.000 (3.627.000.000 (457) 20,367.000.000 18. 122.000.000 2.244.000.000 12 (0031 0.023 Direct Coats 38,045,000,000 40.659,000,000 12,613,000,000 1043) 9.844.000.000 8423,000,000 421,000,000 4,47 2004) 10.00 Gre Prule 35.575,000,000 36.488,000,000 093.000.000 (250) 10.523.000.000 8.700.000.000 1,123.000.000 20.95 10.01 (0011 (064,000,000 731.000.000 41.500.000.000 218191 24 000 000 200.000.000 (185,000,000) (38.52) Netcome 5.540.000.000 9.431,000,000 2,541.000.000 (4073) 1.350.000.000 1361.000.000 18.000.000) 10.37 10.14) 10-14) EPS Connung Basic 6.18 1083 (4186) 1.42 153 (0.11) 17.19) (0.14) (0.131 EPS Met Basic 28 3063 1435 140921 1.52 (0.01) (0.65) 10.13) 10.13 EPS Contur Oluted 6.13 1057 1444) 14201) 1.52 10.11) 0.24) 10.14) 10.13) EPS Not Dilnad 623 100 4331 153 152 10011 10.65) 10.) 11.00 Teem work Rubrix 11) Facebook.html Show All 12/01/2017 als 5 Years Quartiers Refresh ange rate used is that of the Year in reported to itability Ratlos ROA (NA) 2 ROE (Net) 2 ROI (Operating! 3 EBITDA Margin % 7 Calculated Tax Rates 7 Revenue per Employee 12/31/2020 3.02 > 26.9+ 12/31/2016 10.39 72.84 7:41 > 17 >> (18.63) 195,627 12/31/2010 0.84 50 12 13.52 22:32 7.19 201.000 > 12/31/2018 7.02 50 76 > 19.2 2046 23.09> 227,014 4,74 321 > 18.56 29 74 49.49 215873 19.00 21.55 3.54 209573 aldity Rallos Quick Ratio 7 Current Ratio Net Current Assets TA 12/31/2920 083 0.98 12/31/2010 0.87 102 12/01/2018 1.12 1.29 12/31/2017 1.18 1.33 > 9.87 12/31/2016 101 1.25 6.49 12:01/2018 2.12 12/31/2017 226 12/01/2018 1.9 264 Management LT Debt te Equity To Detto Equity interest Coverage 12/31/2019 26 302 094 273 6.21 > 21H 21.05 12/31/2010 et Management Total Asset Turnover 3 Receivables Tumover Inventory Turner Accounts Payable Turnover Accrued Expenses Tumover Property Plant & Equip Turnover Cath Edwants Turnover 11/2017 0.65 20 12/31/2020 0.48 3.45 22 14.96 11.31 732 12/31/2019 0.56 284 2463 18.47 12.24 742 7.75 12/01/2018 064 2.56 2013 1224 27:37 125 2.16 262 1303 1206 739 112 7.27 0.75 10.79 7.21 1024 > 665 Apps Fundamentals of b Currently, trio cos Il Nergen VitalSource Books... SAP Project 2 - G... A transformational... Jean-Ph RO Courtois Ago Salary Executive Vice President, Region Officer 57 777,000 Microsoft Corporation Price 202 281 280 Key Financials (In USD as of 12/31/2020) Share price (minor) 259- 258 257 256 255 254 04/13/2021 04/15/2021 04/19/2021 04/17/2021 Time Income Statement Revenue .153,284 Net Income 51,310m EPS from Continuing Operations 8.71 EPS. Net Income Diluted 0.71 Revenue per Share 20.29 Balance Sheet Total Assets 304,137m Total Liabilities 173,901m Shareholders' Equity 80,236m Total Assets per Share 40.30 Net Assets per Share 17.26 Cash Flows Cash from Operations 68,028m Cash from Investing -11,451m Cash from Financing -50,830m Capital Expenditures 17,592 Cash Flow per Share 8.93 52 Week Range 200.74 18782 Yesterday 258.74 23,200.421.00 5 Days 259.50 25,623,543.00 30 Days 230.35 NIA Close Volume 200.74 - 167 82 52 Week High/Low: % Price Change (100 Days) : 200-Day Moving Avg.: 17.81 220.00 (1) Facebook.html 23 Download Printer Friendly My Morgen Tools 06/20/2020 12352020 USD USD 003012020 USD 143,015.000.000 46.078.000.CCO 56,937.000.000 8.755.000.000 44,281.000.000 582 5 Run Drect Costs Gas Prom Talon come EPS Continuing Base EPS Metal EPS Contung Dited EPS NetOne 06/30/2010 USO 125,843.000.000 42 910,000,000 82,933 000 000 4,445.000.000 39 240,000,000 5.11 Variance USD 17,172,000,000 3.168.000.000 14.004.000.000 4.307.000.000 5,041.000.000 13.66 7.30 16.99 43.075.000.000 14,194.000.000 28.842.000.000 2874.000.000 15.463,000,000 30.033.000.000 12.335,000.000 25,634.000.000 2,220.000.000 $1.202.000.000 140 Variance USD 5,062.000.000 13.20 1.855,000.000 1503 3.188.000.000 12:41 654 000.000 29.46 4.261.000.000 8.04 0.52 3851 OST 3851 0167 30.04 097 3904 Compound Annual Growth Rate 3 Year 5 Year 0.oe 0 1 0.06 0.07 0.10 0.13 1024) 0.24 030 0.39 0.22 0.39 022 0:30 0.22 2.30 12.05 13.09 13.0 2.00 145 5.15 5.00 070 138) 203 2.05 670 SD 070 1383 146 145 . MO Analysis 3 (4 Points) Diagnose the performance of the company featured in the case. Please refer to the following framework in Chapter 2, which is titled: "Performance Diagnosis: Disaggregating Return on Capital Employed"? This framework forms the basis for Analysis 3. COGS/Sales Sales Margin Depreciation Sales SGA expense/Sales ROCE Fixed Asset Turnover (Sales/PPE) Inventory Turnover (Sales/inventories) Sales/Capital You will calculate (or find) the firm's RoCE for at least three years. (You can calculate this from data obtained through Mergent online. Bloomberg provides this information for active companies.) You will then calculate other data points (i.e., Return on Sales, asset productivity, CoGS/ Sales, etc.). The idea is to diagnose the problem that is either currently confronting or might confront the given firm in the future. (What is point of this diagnosis?) This diagnosis helps companies take corrective action. For instance, the ROCE should ideally increase over the three year period. (I do not know but let us say that it did increase in the given company's case.) You will then diagnose which of the twp - Return on Sales or Asset productivity - contributed more to the growth in ROCE over the three year period. Let us say that the RoS declined while the asset productivity increased. This gives you a clue that the RoS is not going in the desired direction. You will then further disaggregate the RoS into various components to find out which of the components (or activities) are causing the problem. It is always better to simultaneously disaggregate RoS and Asset Productivity even if one of them does not seem problematic. THIS ANALYSIS IS WORTH 4 POINTS, Please understand that I cannot award you any points if I do not see at least a table of all calculations. I will award 2 out of four points for the calculations. The other two points are reserved for explaining the data. While I am asking you to disaggregate the RoCE into two components, another method referred to as the "Dupont formula breaks up the RoE into three components. (You can google out "Dupont Formula") I have attached an alternate template for cross-sectional analysis wherein you can compare the data for the given firm with its closest rival. (Pick up any company that you think competes with the given company head-on.) In this template the author Robert Grant compares the data for UPS and Fedex to explain why UPS earns a higher RoCE than its close rival Fedex ompany that you think competes with the given company head-on.) In this template the author Robert Grant compares the data for UPS and Fedex to explain why UPS earns a higher RoCE than its close rival Fedex. Labor costs/Sales U:54.8% :37,0% Fuel costs/Sales U: 7.5% -10,7% Operating margin U 10.19 F: 65% Maintenance/Sales U: 2.3% :4.3% Depreciation/Sales U: 3.4% F: 53% ROCE U:33.3% 1539 Other costs/Sales U:21.4% F: 30.8 PPE tumover U: 3.02 F: 2.36 U-UPS F-FedEx Sales/Capital Employed U: 328 F: 2.34 Receivables turnover U: 10.23 F: 8.59 Cash turnover U:951 F: 1152 Pricing Summary Michelle Browdy Senior Vice President, General Counsel Age 55 Salary 830,000 Time Period 1 week International Business Machines Corp. Price 1340 James Kavanaugh Senior Vice President, Chief Financial Officer Age 53 Salary 899,000 1335 1330 Share price (minon) 132.5- 1320- 1315- 1310 1305- 01/13/2021 04/15/2021 04/19/2021 2017/2021 Time Key Financials (In USD as of 12/31/2020) Income Statement Revenue 73,62m Net Income 5,590m EPS from Continuing Operations 6.13 EPS - Net Income. Dluted 623 Revenue per Share 82.46 Balance Sheet Total Assets 155,971m Total Liabilities 135,373m Shareholders' Equity 20,597m Total Assets per Share 174.73 Net Assets per Share 23.08 Cash Flows Cash from Operations 18.197m Cash from Investing -3,028 Cash from Financing -9,72m Capital Expenditures 2,618m Cash Flow per Share 20.30 52 Week Range 10665 136 38 Close Volume Yesterday 133.12 8,166 308.00 5 Days 132 58 3,883,596.00 30 Days 128.90 N/A 52 Week High/Low 136.38 - 106.65 3.57 % Price Change (100 Days) 200-Day Moving Avg. 123.95 Auditor PricewaterhouseCoopers LLP Industry.omer computer Reid Services NAICS $41519) Net Income: 5,590.000.000 Transfer Agent Completare Trust Company NALO, KY Number of Employees 376 300 Approximate Full-Time as of Dividend: 8.62 Dividend Yield: 48aTe 12/31/2020) EPS Basic: 628 EPS Diluted: 0.23 Country: United States Number of Shareholders: 373,619 records of 10/2023 PE Ratio 21 3676 Company details five ownership Company financials Boulty pricing Anal reportaling News Competitors Report builder supply chain Company reports As reported Preims Standardized Restated Ratios Analysis Income statementaleshootRate analysis Download Printer Friendly My target Tool 12/31/2000 12/31/2019 Variance 12191/2020 2020 Variance Compound Annual Growth Rate Nem USD USD USD % USO USD USD % 3 Year Year Revenons 73.620,000,000 77.147.000.000 (3.627.000.000 (457) 20,367.000.000 18. 122.000.000 2.244.000.000 12 (0031 0.023 Direct Coats 38,045,000,000 40.659,000,000 12,613,000,000 1043) 9.844.000.000 8423,000,000 421,000,000 4,47 2004) 10.00 Gre Prule 35.575,000,000 36.488,000,000 093.000.000 (250) 10.523.000.000 8.700.000.000 1,123.000.000 20.95 10.01 (0011 (064,000,000 731.000.000 41.500.000.000 218191 24 000 000 200.000.000 (185,000,000) (38.52) Netcome 5.540.000.000 9.431,000,000 2,541.000.000 (4073) 1.350.000.000 1361.000.000 18.000.000) 10.37 10.14) 10-14) EPS Connung Basic 6.18 1083 (4186) 1.42 153 (0.11) 17.19) (0.14) (0.131 EPS Met Basic 28 3063 1435 140921 1.52 (0.01) (0.65) 10.13) 10.13 EPS Contur Oluted 6.13 1057 1444) 14201) 1.52 10.11) 0.24) 10.14) 10.13) EPS Not Dilnad 623 100 4331 153 152 10011 10.65) 10.) 11.00 Teem work Rubrix 11) Facebook.html Show All 12/01/2017 als 5 Years Quartiers Refresh ange rate used is that of the Year in reported to itability Ratlos ROA (NA) 2 ROE (Net) 2 ROI (Operating! 3 EBITDA Margin % 7 Calculated Tax Rates 7 Revenue per Employee 12/31/2020 3.02 > 26.9+ 12/31/2016 10.39 72.84 7:41 > 17 >> (18.63) 195,627 12/31/2010 0.84 50 12 13.52 22:32 7.19 201.000 > 12/31/2018 7.02 50 76 > 19.2 2046 23.09> 227,014 4,74 321 > 18.56 29 74 49.49 215873 19.00 21.55 3.54 209573 aldity Rallos Quick Ratio 7 Current Ratio Net Current Assets TA 12/31/2920 083 0.98 12/31/2010 0.87 102 12/01/2018 1.12 1.29 12/31/2017 1.18 1.33 > 9.87 12/31/2016 101 1.25 6.49 12:01/2018 2.12 12/31/2017 226 12/01/2018 1.9 264 Management LT Debt te Equity To Detto Equity interest Coverage 12/31/2019 26 302 094 273 6.21 > 21H 21.05 12/31/2010 et Management Total Asset Turnover 3 Receivables Tumover Inventory Turner Accounts Payable Turnover Accrued Expenses Tumover Property Plant & Equip Turnover Cath Edwants Turnover 11/2017 0.65 20 12/31/2020 0.48 3.45 22 14.96 11.31 732 12/31/2019 0.56 284 2463 18.47 12.24 742 7.75 12/01/2018 064 2.56 2013 1224 27:37 125 2.16 262 1303 1206 739 112 7.27 0.75 10.79 7.21 1024 > 665 Apps Fundamentals of b Currently, trio cos Il Nergen VitalSource Books... SAP Project 2 - G... A transformational... Jean-Ph RO Courtois Ago Salary Executive Vice President, Region Officer 57 777,000 Microsoft Corporation Price 202 281 280 Key Financials (In USD as of 12/31/2020) Share price (minor) 259- 258 257 256 255 254 04/13/2021 04/15/2021 04/19/2021 04/17/2021 Time Income Statement Revenue .153,284 Net Income 51,310m EPS from Continuing Operations 8.71 EPS. Net Income Diluted 0.71 Revenue per Share 20.29 Balance Sheet Total Assets 304,137m Total Liabilities 173,901m Shareholders' Equity 80,236m Total Assets per Share 40.30 Net Assets per Share 17.26 Cash Flows Cash from Operations 68,028m Cash from Investing -11,451m Cash from Financing -50,830m Capital Expenditures 17,592 Cash Flow per Share 8.93 52 Week Range 200.74 18782 Yesterday 258.74 23,200.421.00 5 Days 259.50 25,623,543.00 30 Days 230.35 NIA Close Volume 200.74 - 167 82 52 Week High/Low: % Price Change (100 Days) : 200-Day Moving Avg.: 17.81 220.00 (1) Facebook.html 23 Download Printer Friendly My Morgen Tools 06/20/2020 12352020 USD USD 003012020 USD 143,015.000.000 46.078.000.CCO 56,937.000.000 8.755.000.000 44,281.000.000 582 5 Run Drect Costs Gas Prom Talon come EPS Continuing Base EPS Metal EPS Contung Dited EPS NetOne 06/30/2010 USO 125,843.000.000 42 910,000,000 82,933 000 000 4,445.000.000 39 240,000,000 5.11 Variance USD 17,172,000,000 3.168.000.000 14.004.000.000 4.307.000.000 5,041.000.000 13.66 7.30 16.99 43.075.000.000 14,194.000.000 28.842.000.000 2874.000.000 15.463,000,000 30.033.000.000 12.335,000.000 25,634.000.000 2,220.000.000 $1.202.000.000 140 Variance USD 5,062.000.000 13.20 1.855,000.000 1503 3.188.000.000 12:41 654 000.000 29.46 4.261.000.000 8.04 0.52 3851 OST 3851 0167 30.04 097 3904 Compound Annual Growth Rate 3 Year 5 Year 0.oe 0 1 0.06 0.07 0.10 0.13 1024) 0.24 030 0.39 0.22 0.39 022 0:30 0.22 2.30 12.05 13.09 13.0 2.00 145 5.15 5.00 070 138) 203 2.05 670 SD 070 1383 146 145