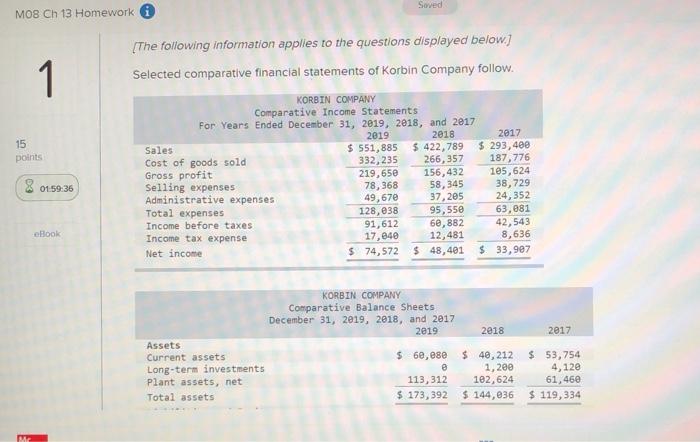
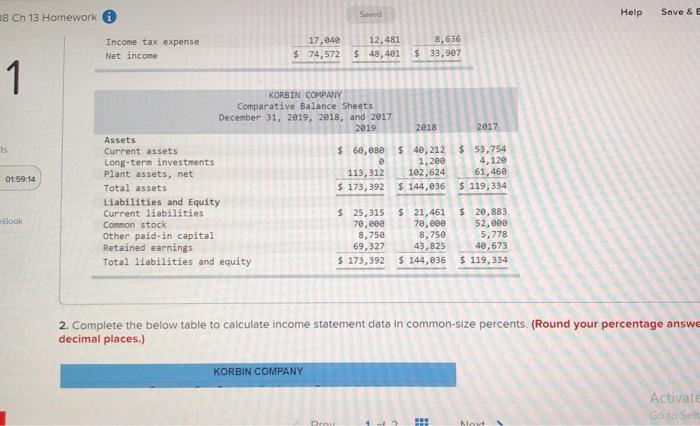
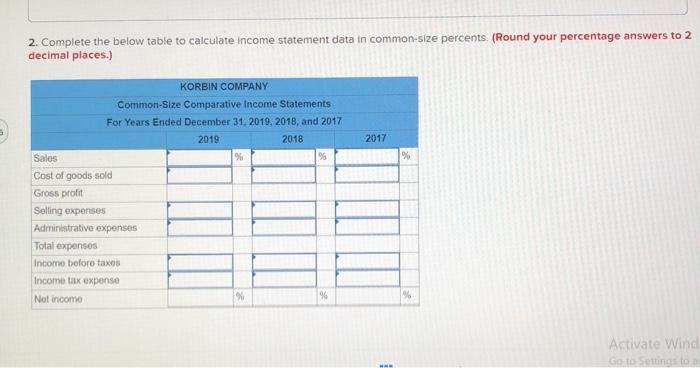
MO8 Ch 13 Homework The following information applies to the questions displayed below) 1 Selected comparative financial statements of Korbin Company follow. 15 points 8 01:59:36 KORBIN COMPANY Comparative Income Statements For Years Ended December 31, 2019, 2018, and 2017 2019 2018 2017 Sales $ 551,885 $ 422,789 $ 293,400 Cost of goods sold 332,235 266, 357 187,776 Gross profit 219,650 156,432 185,624 Selling expenses 78,368 58,345 38,729 Administrative expenses 49,670 37,205 24,352 Total expenses 128, e38 95,550 63,881 Income before taxes 91,612 68,882 42,543 Income tax expense 17,840 12,481 8,636 Net income $ 74,572 $ 48,401 $ 33,907 Book 2018 2017 KORBIN COMPANY Comparative Balance Sheets December 31, 2019, 2018, and 2017 2019 Assets Current assets $ 60, ese Long-term investments 8 Plant assets, net 113,312 Total assets $ 173,392 $ 48,212 1,200 102,624 $ 144,036 $ 53,754 4,120 61,460 $ 119,334 Me Saved Help Save & E 08 Ch 13 Homework Income tax expense Net income 17,040 $ 74,572 12,481 $ 48,401 8,656 $ 33,907 1 2018 2017 KORBIN COMPANY Comparative Balance Sheets December 31, 2019, 2018, and 2017 2019 Assets Current assets $ 68,080 e Long-term investments Plant assets, net 113,312 Total assets $ 173,392 Liabilities and Equity Current liabilities $ 25,315 Common stock 70,000 Other paid-in capital 8,750 Retained earnings 69,327 Total liabilities and equity $ 173,392 $ 40,212 1,200 102,624 $ 144,036 $ 53,754 4,120 61,468 $ 119,334 01:59:14 Book $ 21,461 70,000 8,750 43,825 $ 144,036 $ 20,883 52,880 5,778 40,673 $ 119,334 2. Complete the below table to calculate income statement data in common-size percents (Round your percentage answe decimal places.) KORBIN COMPANY Activate Go to Sell Pre Moyo 2. Complete the below table to calculate income statement data in common-size percents (Round your percentage answers to 2 decimal places.) 2017 KORBIN COMPANY Common-Size Comparative Income Statements For Years Ended December 31, 2019, 2018, and 2017 2019 2018 Sales % Cost of goods sold Gross profit Selling expenses Administrative expenses Total expenses Income before taxes Income tax expenso 94 Not income % Activate Wind


