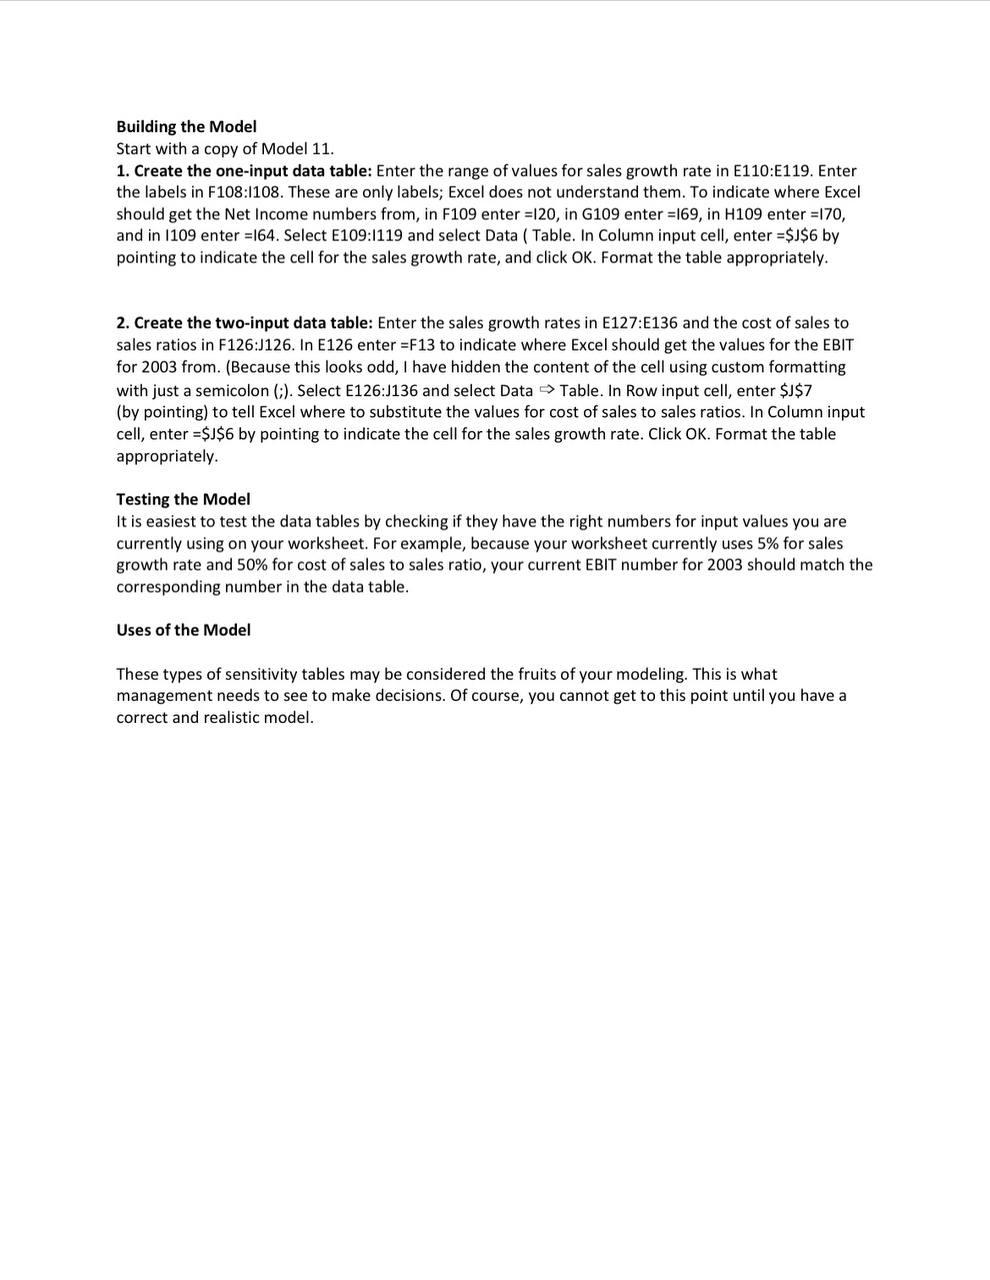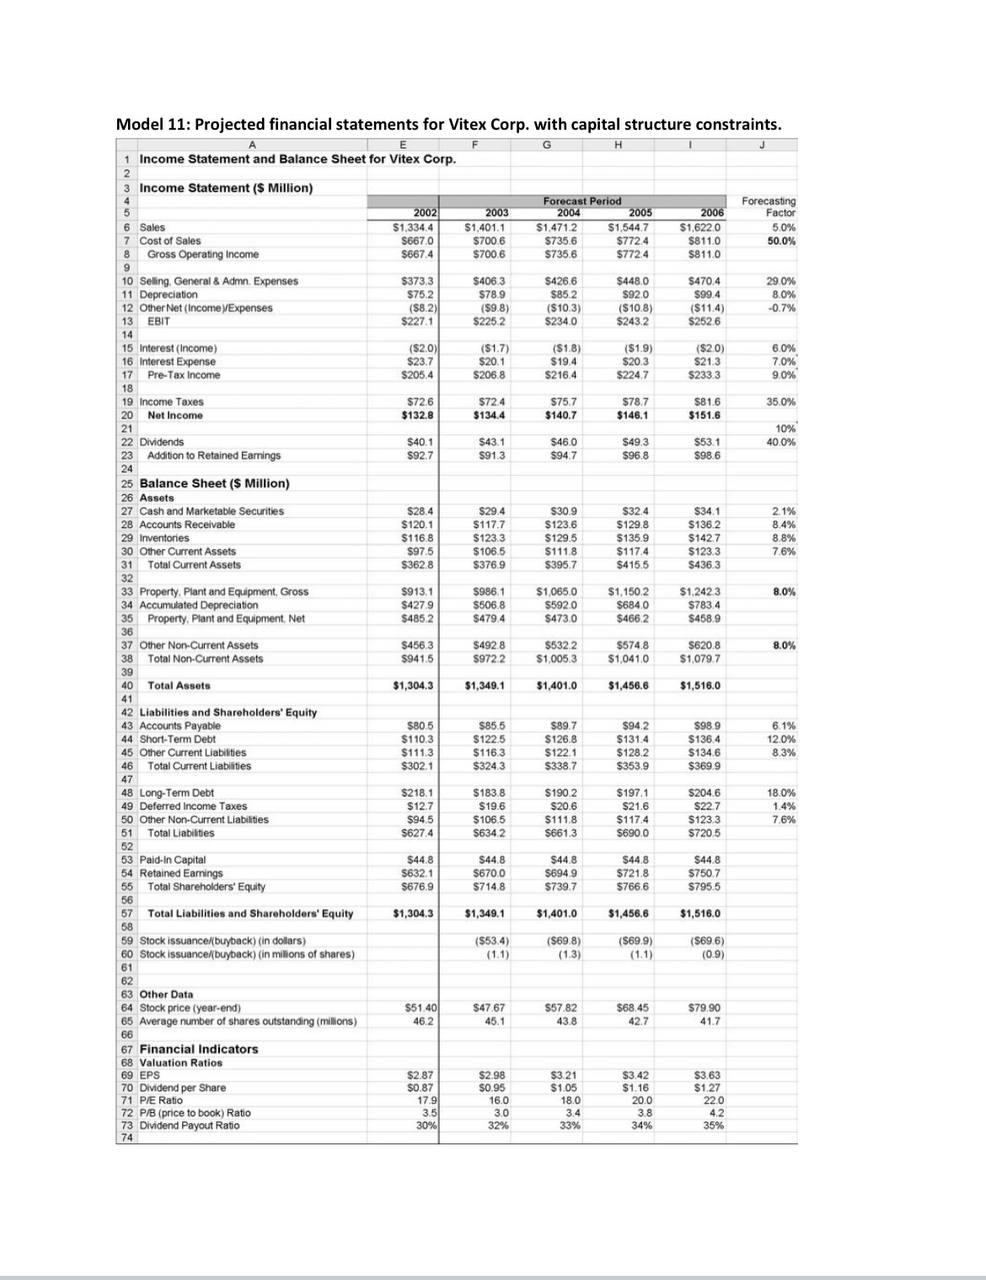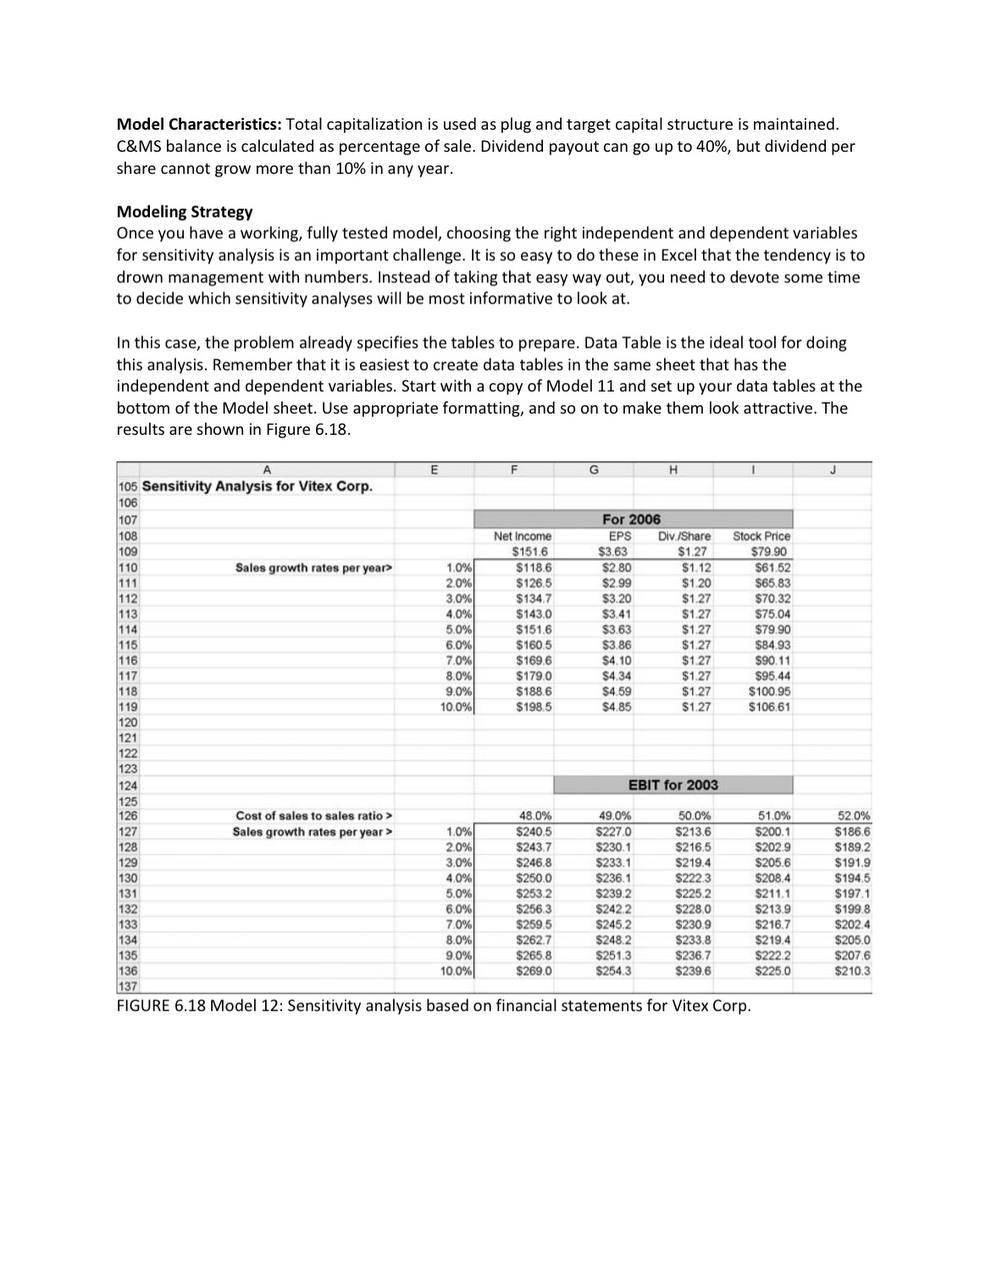


MODEL 12: FINANCIAL STATEMENTS SENSITIVITY ANALYSIS The Problem One of the major uses of financial statement forecasting models is to do sensitivity analysis. We can see the effect of making changes in any of the input (independent) variables on the other dependent variable by making the changes in the model. But trying these out one at a time does not provide us a comprehensive picture. Your management wants to see how Net Income, EPS, dividend per share, and stock price will change for 2006 for sales growth rates from 1% to 10% per year over the years. Create a one-input data table to show this information. Also create a two-input data table to show how EBIT for 2003 will depend on cost of sales to sales ratio and sales growth rate in a reasonable range. (Use Model 11 for your analysis.) Building the Model Start with a copy of Model 11. 1. Create the one-input data table: Enter the range of values for sales growth rate in E110:E119. Enter the labels in F108:1108. These are only labels; Excel does not understand them. To indicate where Excel should get the Net Income numbers from, in F109 enter =120, in G109 enter =169, in H109 enter =170, and in 1109 enter =164. Select E109:1119 and select Data ( Table. In Column input cell, enter =$J$6 by pointing to indicate the cell for the sales growth rate, and click OK. Format the table appropriately. 2. Create the two-input data table: Enter the sales growth rates in E127:1136 and the cost of sales to sales ratios in F126:J126. In E126 enter =F13 to indicate where Excel should get the values for the EBIT for 2003 from. (Because this looks odd, I have hidden the content of the cell using custom formatting with just a semicolon (;). Select E126:J136 and select Data Table. In Row input cell, enter $J$ 7 (by pointing) to tell Excel where to substitute the values for cost of sales to sales ratios. In Column input cell, enter =$J$6 by pointing to indicate the cell for the sales growth rate. Click OK. Format the table appropriately. Testing the Model It is easiest to test the data tables by checking if they have the right numbers for input values you are currently using on your worksheet. For example, because your worksheet currently uses 5% for sales growth rate and 50% for cost of sales to sales ratio, your current EBIT number for 2003 should match the corresponding number in the data table. Uses of the Model These types of sensitivity tables may be considered the fruits of your modeling. This is what management needs to see to make decisions. Of course, you cannot get to this point until you have a correct and realistic model. Model 11: Projected financial statements for Vitex Corp. with capital structure constraints. E G H 1 1 Income Statement and Balance Sheet for Vitex Corp. 2 3 Income Statement ($ Million) Forecast Period Forecasting 5 2002 2003 2004 2005 2006 Factor 6 Sales 6 $1,334.4 $1,401.1 $1.4712 $1,5447 $1,6220 50% 7 Cost of Sales $6670 $700 6 S735.6 $772.4 $811.0 50.0% 8 Gross Operating Income $667.4 $700.6 $735.6 $7724 $8110 9 10 Seling, General & Admn. Expenses $373,3 $4063 $426,6 $4480 $470.4 29 0% 11 Depreciation $75.2 $78.9 $85 2 $920 $99.4 80% 12 Other Net Income Expenses (582) (59.8) ($10.3) ($10.8) ($11.4) -0.7% 13 EBIT $2271 $2252 $234.0 $ $243.2 S2526 14 15 Interest (Income) ($2.0) ($1.7) ($1.8) ($1.9) ($20) 6.0% 16 Interest Expense $23.7 $20.1 $19.4 $20.3 $21.3 $ 7.0% 17 Pre-Tax Income $205.4 $206.8 S216.4 $2247 $2333 90% 18 19 Income Taxes $726 $724 $75.7 $78.7 $81.6 35.0% 20 Not Income $132.8 $134.4 $140.7 $146.1 $151.6 21 10% 22 Dividends $40.1 $43.1 $460 $49.3 $53.1 40.0% 23 Addition to Retained Earnings $92.7 5913 $947 $96.8 $98.6 24 25 Balance Sheet ($ Million) 26 Assets 27 Cash and Marketable Securities $28.4 $29.4 $30.9 $32.4 $34.1 2.1% 28 Accounts Receivable $120.1 $117.7 $123.6 $129.8 $136.2 8.4% 29 Inventories $116.8 $123.3 $129.5 $135.9 $1427 8.8% 30 Other Current Assets $97.5 $106.5 $111.8 $117.4 $123.3 76% 31 Total Current Assets $3628 $376.9 $395.7 $4155 $4363 32 33 Property. Plant and Equipment Gross $913.1 $9861 $1,0650 $1,150,2 $1,2423 8.0% 34 Accumulated Depreciation $4279 $506.8 $5920 $6840 $783.4 35 Property, Plant and Equipment. Net $4852 $4794 $4730 $4662 $458.9 36 37 Other Non-Current Assets $4563 $4928 $5322 $574.8 $6208 8.0% 38 Total Non-Current Assets $941.5 59722 $1,0053 $1,041.0 $1,079.7 39 40 Total Assets $1,304.3 $1,349.1 $1,401.0 $1,456.6 $1,516.0 41 42 Liabilities and Shareholders' Equity 43 Accounts Payable S80 5 $855 $89.7 $94.2 $98.9 6.1% 44 Short-Term Debt $110,3 $122.5 $126.8 $131.4 $136.4 120% 45 Other Current Liabilities $111.3 $116.3 $122.1 $128.2 $1346 8.3% 46 Total Current Liabilities $302.1 $3243 $338.7 $ $353.9 $3699 47 48 Long-Term Debt $218.1 $183.8 $190.2 $197.1 $2046 18.0% 49 Deferred Income Taxes $12.7 $19.6 $20.6 $21.6 $22.7 1.4% 50 Other Non-Current Liabilities $94.5 $106.5 $111.8 $117.4 $1233 7.6% 51 Total Liabilities $627.4 S6342 $661,3 $690.0 $7205 52 53 Paid In Capital $44.8 $44.8 $44.8 $44.8 $44.8 54 Retained Earnings $632 1 $6700 $6949 $721.8 $750.7 55 Total Shareholders' Equity $676.9 $714.8 $739.7 $7666 $795.5 56 57 Total Liabilities and Shareholders' Equity $1,304.3 $1,349.1 $1,401.0 $1,456.6 $1,516.0 58 59 Stock issuance/buyback) (in dollars) ( (553.4) ($69.8) (569.9) (569.6) 60 Stock issuance/buyback) (in milions of shares) ( (1.3) (1.1) (0.9) 61 62 63 Other Data 64 Stock price (year-end) $51 401 $47.67 $57 82 $68.45 $79.90 65 Average number of shares outstanding (milions) 46.2 45.1 438 42.7 41.7 66 67 Financial Indicators 68 Valuation Ratios 69 EPS $287 $2.98 $321 $3.42 $3.63 70 Dividend per Share $0.87 $0.95 $1.05 $1.16 $1.27 71 P/E Ratio 179 16.0 18.0 200 22.0 72 P/B (price to book) Ratio 3.5 3.0 3.4 3.8 4.2 73 Dividend Payout Ratio 30% 32% 33% 34% 35% 74 Model Characteristics: Total capitalization is used as plug and target capital structure is maintained. C&MS balance is calculated as percentage of sale. Dividend payout can go up to 40%, but dividend per share cannot grow more than 10% in any year. Modeling Strategy Once you have a working, fully tested model, choosing the right independent and dependent variables for sensitivity analysis is an important challenge. It is so easy to do these in Excel that the tendency is to drown management with numbers. Instead of taking that easy way out, you need to devote some time to decide which sensitivity analyses will be most informative to look at. In this case, the problem already specifies the tables to prepare. Data Table is the ideal tool for doing this analysis. Remember that it is easiest to create data tables in the same sheet that has the independent and dependent variables. Start with a copy of Model 11 and set up your data tables at the bottom of the Model sheet. Use appropriate formatting, and so on to make them look attractive. The results are shown in Figure 6.18. E G H 105 Sensitivity Analysis for Vitex Corp. 106 107 For 2006 108 Net Income EPS Div./Share Stock Price 109 $151.6 $ $3.63 $1.27 $79.90 110 Sales growth rates per year 1.0% $118.6 $2.80 $ $1.12 $61.52 111 2.0% $126,5 $2.99 $1.20 $65.83 112 24 3.0% $134.7 $3.20 $1.27 $70.32 113 4.0% % $143.0 $3.41 $1.27 $75.04 114 5.0% $1648 $1516 $3.63 1115 $1.27 $79.90 6.0% % $160.5 $3.86 $1.27 $84.93 116 7.0% $1696 $4.10 $1.27 $90.11 117 8.0% $179.0 $4.34 $1.27 $95.44 118 9.0% $188.6 $4.59 $1.27 $100.95 119 10.0% $198.5 $4.85 $1.27 $106.61 120 112 121 122 140 123 124 EBIT for 2003 125 126 Cost of sales to sales ratio > 48.0% 49,0% 50.0% 51.0% 127 Sales growth rates per year > 10% $240.5 $2270 $2136 $200.1 128 2.0% $243.7 $230.1 $216.5 $202.9 129 3.0% $246.8 $233.1 $219.4 $205.6 130 4.0% $250 0 $236.1 $2223 $208.4 131 5.0% $253.2 $239.2 $225.2 $211.1 132 6.0% $256.3 $2422 $2280 $213.9 133 70% $2595 $245 2 S230 9 $216.7 134 8.0% $262.7 $248.2 $2338 $2194 135 9.0% $265.8 $251.3 $236.7 $2222 136 10.0% $269,0 $254.3 $239.6 $225 0 137 FIGURE 6.18 Model 12: Sensitivity analysis based on financial statements for Vitex Corp. 52.0% $186.6 $189.2 $191,9 $1945 $197.1 $199.8 S2024 $205.0 $2076 $210.3 MODEL 12: FINANCIAL STATEMENTS SENSITIVITY ANALYSIS The Problem One of the major uses of financial statement forecasting models is to do sensitivity analysis. We can see the effect of making changes in any of the input (independent) variables on the other dependent variable by making the changes in the model. But trying these out one at a time does not provide us a comprehensive picture. Your management wants to see how Net Income, EPS, dividend per share, and stock price will change for 2006 for sales growth rates from 1% to 10% per year over the years. Create a one-input data table to show this information. Also create a two-input data table to show how EBIT for 2003 will depend on cost of sales to sales ratio and sales growth rate in a reasonable range. (Use Model 11 for your analysis.) Building the Model Start with a copy of Model 11. 1. Create the one-input data table: Enter the range of values for sales growth rate in E110:E119. Enter the labels in F108:1108. These are only labels; Excel does not understand them. To indicate where Excel should get the Net Income numbers from, in F109 enter =120, in G109 enter =169, in H109 enter =170, and in 1109 enter =164. Select E109:1119 and select Data ( Table. In Column input cell, enter =$J$6 by pointing to indicate the cell for the sales growth rate, and click OK. Format the table appropriately. 2. Create the two-input data table: Enter the sales growth rates in E127:1136 and the cost of sales to sales ratios in F126:J126. In E126 enter =F13 to indicate where Excel should get the values for the EBIT for 2003 from. (Because this looks odd, I have hidden the content of the cell using custom formatting with just a semicolon (;). Select E126:J136 and select Data Table. In Row input cell, enter $J$ 7 (by pointing) to tell Excel where to substitute the values for cost of sales to sales ratios. In Column input cell, enter =$J$6 by pointing to indicate the cell for the sales growth rate. Click OK. Format the table appropriately. Testing the Model It is easiest to test the data tables by checking if they have the right numbers for input values you are currently using on your worksheet. For example, because your worksheet currently uses 5% for sales growth rate and 50% for cost of sales to sales ratio, your current EBIT number for 2003 should match the corresponding number in the data table. Uses of the Model These types of sensitivity tables may be considered the fruits of your modeling. This is what management needs to see to make decisions. Of course, you cannot get to this point until you have a correct and realistic model. Model 11: Projected financial statements for Vitex Corp. with capital structure constraints. E G H 1 1 Income Statement and Balance Sheet for Vitex Corp. 2 3 Income Statement ($ Million) Forecast Period Forecasting 5 2002 2003 2004 2005 2006 Factor 6 Sales 6 $1,334.4 $1,401.1 $1.4712 $1,5447 $1,6220 50% 7 Cost of Sales $6670 $700 6 S735.6 $772.4 $811.0 50.0% 8 Gross Operating Income $667.4 $700.6 $735.6 $7724 $8110 9 10 Seling, General & Admn. Expenses $373,3 $4063 $426,6 $4480 $470.4 29 0% 11 Depreciation $75.2 $78.9 $85 2 $920 $99.4 80% 12 Other Net Income Expenses (582) (59.8) ($10.3) ($10.8) ($11.4) -0.7% 13 EBIT $2271 $2252 $234.0 $ $243.2 S2526 14 15 Interest (Income) ($2.0) ($1.7) ($1.8) ($1.9) ($20) 6.0% 16 Interest Expense $23.7 $20.1 $19.4 $20.3 $21.3 $ 7.0% 17 Pre-Tax Income $205.4 $206.8 S216.4 $2247 $2333 90% 18 19 Income Taxes $726 $724 $75.7 $78.7 $81.6 35.0% 20 Not Income $132.8 $134.4 $140.7 $146.1 $151.6 21 10% 22 Dividends $40.1 $43.1 $460 $49.3 $53.1 40.0% 23 Addition to Retained Earnings $92.7 5913 $947 $96.8 $98.6 24 25 Balance Sheet ($ Million) 26 Assets 27 Cash and Marketable Securities $28.4 $29.4 $30.9 $32.4 $34.1 2.1% 28 Accounts Receivable $120.1 $117.7 $123.6 $129.8 $136.2 8.4% 29 Inventories $116.8 $123.3 $129.5 $135.9 $1427 8.8% 30 Other Current Assets $97.5 $106.5 $111.8 $117.4 $123.3 76% 31 Total Current Assets $3628 $376.9 $395.7 $4155 $4363 32 33 Property. Plant and Equipment Gross $913.1 $9861 $1,0650 $1,150,2 $1,2423 8.0% 34 Accumulated Depreciation $4279 $506.8 $5920 $6840 $783.4 35 Property, Plant and Equipment. Net $4852 $4794 $4730 $4662 $458.9 36 37 Other Non-Current Assets $4563 $4928 $5322 $574.8 $6208 8.0% 38 Total Non-Current Assets $941.5 59722 $1,0053 $1,041.0 $1,079.7 39 40 Total Assets $1,304.3 $1,349.1 $1,401.0 $1,456.6 $1,516.0 41 42 Liabilities and Shareholders' Equity 43 Accounts Payable S80 5 $855 $89.7 $94.2 $98.9 6.1% 44 Short-Term Debt $110,3 $122.5 $126.8 $131.4 $136.4 120% 45 Other Current Liabilities $111.3 $116.3 $122.1 $128.2 $1346 8.3% 46 Total Current Liabilities $302.1 $3243 $338.7 $ $353.9 $3699 47 48 Long-Term Debt $218.1 $183.8 $190.2 $197.1 $2046 18.0% 49 Deferred Income Taxes $12.7 $19.6 $20.6 $21.6 $22.7 1.4% 50 Other Non-Current Liabilities $94.5 $106.5 $111.8 $117.4 $1233 7.6% 51 Total Liabilities $627.4 S6342 $661,3 $690.0 $7205 52 53 Paid In Capital $44.8 $44.8 $44.8 $44.8 $44.8 54 Retained Earnings $632 1 $6700 $6949 $721.8 $750.7 55 Total Shareholders' Equity $676.9 $714.8 $739.7 $7666 $795.5 56 57 Total Liabilities and Shareholders' Equity $1,304.3 $1,349.1 $1,401.0 $1,456.6 $1,516.0 58 59 Stock issuance/buyback) (in dollars) ( (553.4) ($69.8) (569.9) (569.6) 60 Stock issuance/buyback) (in milions of shares) ( (1.3) (1.1) (0.9) 61 62 63 Other Data 64 Stock price (year-end) $51 401 $47.67 $57 82 $68.45 $79.90 65 Average number of shares outstanding (milions) 46.2 45.1 438 42.7 41.7 66 67 Financial Indicators 68 Valuation Ratios 69 EPS $287 $2.98 $321 $3.42 $3.63 70 Dividend per Share $0.87 $0.95 $1.05 $1.16 $1.27 71 P/E Ratio 179 16.0 18.0 200 22.0 72 P/B (price to book) Ratio 3.5 3.0 3.4 3.8 4.2 73 Dividend Payout Ratio 30% 32% 33% 34% 35% 74 Model Characteristics: Total capitalization is used as plug and target capital structure is maintained. C&MS balance is calculated as percentage of sale. Dividend payout can go up to 40%, but dividend per share cannot grow more than 10% in any year. Modeling Strategy Once you have a working, fully tested model, choosing the right independent and dependent variables for sensitivity analysis is an important challenge. It is so easy to do these in Excel that the tendency is to drown management with numbers. Instead of taking that easy way out, you need to devote some time to decide which sensitivity analyses will be most informative to look at. In this case, the problem already specifies the tables to prepare. Data Table is the ideal tool for doing this analysis. Remember that it is easiest to create data tables in the same sheet that has the independent and dependent variables. Start with a copy of Model 11 and set up your data tables at the bottom of the Model sheet. Use appropriate formatting, and so on to make them look attractive. The results are shown in Figure 6.18. E G H 105 Sensitivity Analysis for Vitex Corp. 106 107 For 2006 108 Net Income EPS Div./Share Stock Price 109 $151.6 $ $3.63 $1.27 $79.90 110 Sales growth rates per year 1.0% $118.6 $2.80 $ $1.12 $61.52 111 2.0% $126,5 $2.99 $1.20 $65.83 112 24 3.0% $134.7 $3.20 $1.27 $70.32 113 4.0% % $143.0 $3.41 $1.27 $75.04 114 5.0% $1648 $1516 $3.63 1115 $1.27 $79.90 6.0% % $160.5 $3.86 $1.27 $84.93 116 7.0% $1696 $4.10 $1.27 $90.11 117 8.0% $179.0 $4.34 $1.27 $95.44 118 9.0% $188.6 $4.59 $1.27 $100.95 119 10.0% $198.5 $4.85 $1.27 $106.61 120 112 121 122 140 123 124 EBIT for 2003 125 126 Cost of sales to sales ratio > 48.0% 49,0% 50.0% 51.0% 127 Sales growth rates per year > 10% $240.5 $2270 $2136 $200.1 128 2.0% $243.7 $230.1 $216.5 $202.9 129 3.0% $246.8 $233.1 $219.4 $205.6 130 4.0% $250 0 $236.1 $2223 $208.4 131 5.0% $253.2 $239.2 $225.2 $211.1 132 6.0% $256.3 $2422 $2280 $213.9 133 70% $2595 $245 2 S230 9 $216.7 134 8.0% $262.7 $248.2 $2338 $2194 135 9.0% $265.8 $251.3 $236.7 $2222 136 10.0% $269,0 $254.3 $239.6 $225 0 137 FIGURE 6.18 Model 12: Sensitivity analysis based on financial statements for Vitex Corp. 52.0% $186.6 $189.2 $191,9 $1945 $197.1 $199.8 S2024 $205.0 $2076 $210.3


