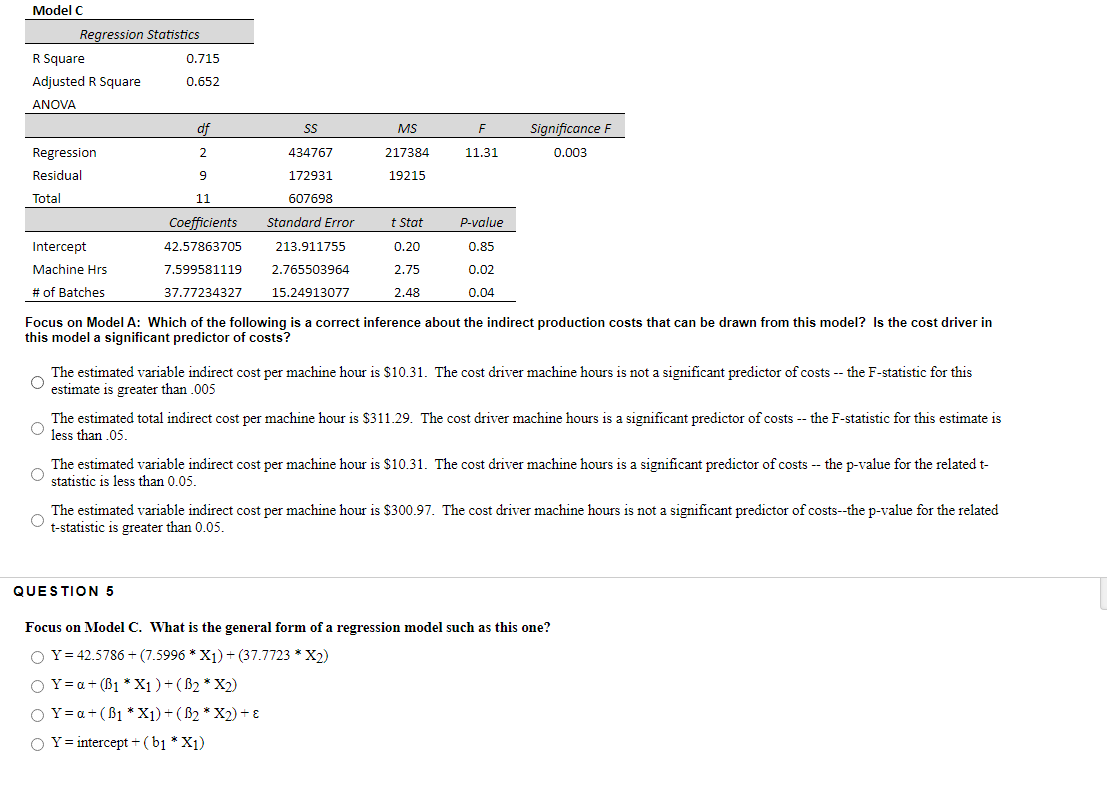
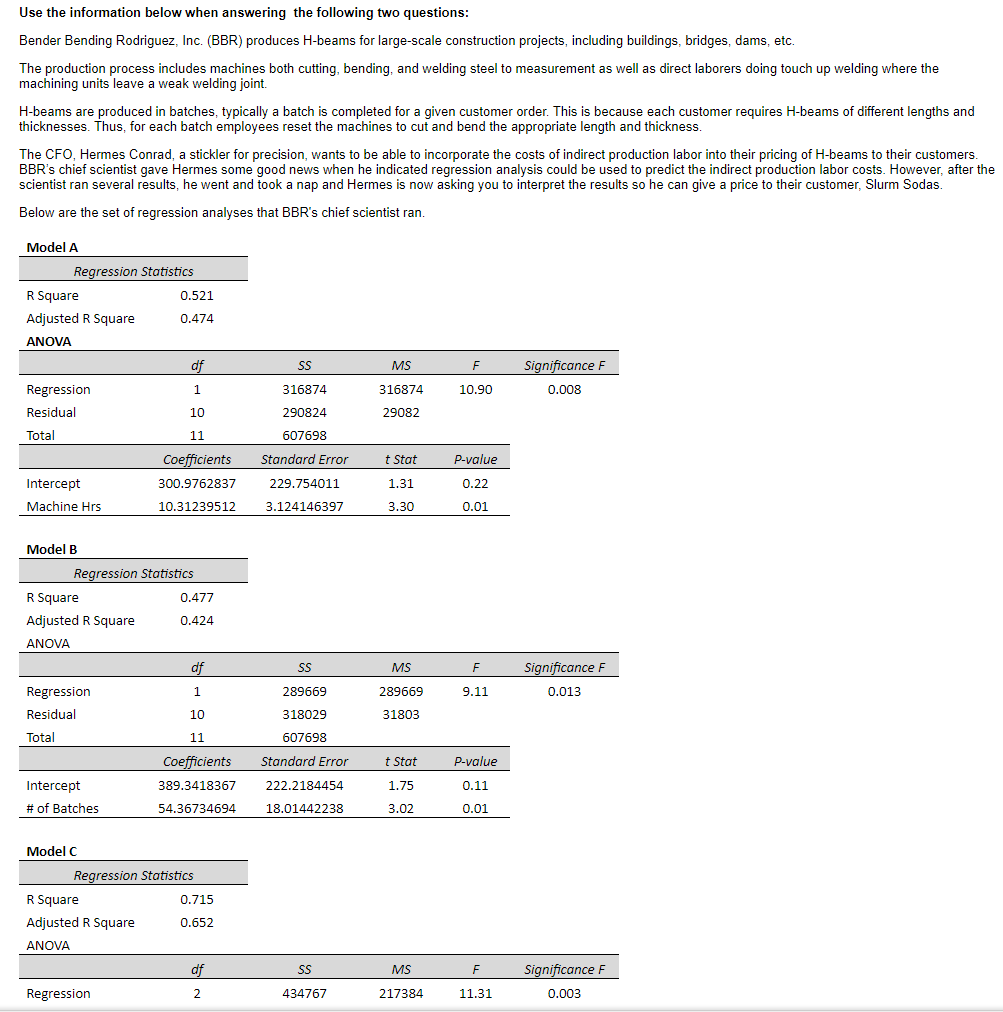
Model (3 Regression Statistics R Sq ua re 0.715 Adjusted R Square 0.652 ANOVA of 55 MS F Signicance F Regression 2 434757 217384 11.31 0.003 Residual 9 172931 19215 Total 11 607698 Coefficients Standard Error tStart Pwlue Intercept 4257853705 213911755 0.20 0.85 Machine Hrs 7599581119 1755503954 2.75 0.02 H of Batches 37.77234327 1524913077 2.4-8 0.04 Focus on Model A: Which of the following is a correct inference about the indirect production costs that can be drawn from this model? Is the cost driver in this model a signicant predictor of costs? "he estimated variable indirect cost per machine hour is $10.31. The cost driver machine hours is not a significant predictor ofcosts the Fstatistic for this 0 estimate is greater than .005 0 "he estimated total indirect cost per machine hour is $311.29. The cost driver machine hours is a significant predictor ofcosts the Fstatistic for this estimate is less than .05. "he estimated variable indirect cost per machine hour is $10.31. The cost driver machine hours is a signicant predictor ofoosts the p-value for the related t 0 statistic is less than 0.05. "he estimated variable indirect cost per machine hour is $300.97. The cost driver machine hours is not a signicant predictor of coststhe pvalue for the related 0 statistic is greater than 0.05. QUESTION 5 Focus on Itindel C. \"diet is the general form of a regression model such as this one? O Y: 42.5786 + (7.5996 \" X1) + (37.7723 ' X3) 0 Y=a+(l'X1)+(z"X2) O Y=a+(l}1\"X1)+(g'X2)+E O Y=intercept+(b1" X1) Use the information below when answering the following two questions: Bender Bending Rodriguez, Inc. (BBR) produces H-beams for large-scale construction projects, including buildings, bridges, dams, etc. The production process includes machines both cutting, bending, and welding steel to measurement as well as direct laborers doing touch up welding where the machining units leave a weak welding joint. H-beams are produced in batches, typically a batch is completed for a given customer order. This is because each customer requires H-beams of different lengths and thicknesses. Thus, for each batch employees reset the machines to cut and bend the appropriate length and thickness The CFO, Hermes Conrad, a stickler for precision, wants to be able to incorporate the costs of indirect production labor into their pricing of H-beams to their customers. BBR's chief scientist gave Hermes some good news when he indicated regression analysis could be used to predict the indirect production labor costs. However, after the scientist ran several results, he went and took a nap and Hermes is now asking you to interpret the results so he can give a price to their customer, Slurm Sodas Below are the set of regression analyses that BBR's chief scientist ran. Model A Regression Statistics R Square 0.521 Adjusted R Square 0.474 ANOVA MS F Significance F Regression 1 316874 16874 10.90 0.008 Residual 10 290824 29082 Total 11 607698 Coefficients Standard Error t Stat P-value Intercept 300.9762837 229.75401 1.3: 0.22 Machine Hrs 10.31239512 3.124146397 3.30 0.01 Model B Regression Statistics R Square 0.477 Adjusted R Square 0.424 ANOVA 55 MS F Significance F Regression 1 289669 289669 9.11 0.013 Residual 10 318029 31803 Total 11 607698 Coefficients Standard Error Stat -value Intercept 389.3418367 222.2184454 1.75 0.11 # of Batches 54.36734694 18.01442238 3.02 0.01 Model C Regression Statistics R Square 0.715 Adjusted R Square 0.652 ANOVA SS MS F Significance F Regression 2 134767 217384 11.31 0.003


