

Question
Model checking: in Exercise 2.13(below), the counts of airline fatalities in 19761985 were fitted to four different Poisson models. Question: For each of the models,
Model checking: in Exercise 2.13(below), the counts of airline fatalities in 19761985 were fitted to four different Poisson models.
Question: For each of the models, use simulations from the posterior predictive distributions to measure the discrepancies. Display the discrepancies graphically and give p-values.
!!!!!!!!!Need some smart guys to think about!!!!!!!!! Appreciate!
Exercise 2.13 is below:
(a) Assume that the numbers of fatal accidents in each year are independent with a Poisson() distribution. Set a prior distribution for and determine the posterior distribution based on the data from 1976 through 1985. Under this model, give a 95% predictive interval for the number of fatal accidents in 1986. You can use the normal approximation to the gamma and Poisson or compute using simulation.
(b) Assume that the numbers of fatal accidents in each year follow independent Poisson distributions with a constant rate and an exposure in each year proportional to the number of passenger miles flown. Set a prior distribution for and determine the posterior distribution based on the data for 19761985. (Estimate the number of passenger miles flown in each year by dividing the appropriate columns of Table 2.2 and ignoring round-off errors.) Give a 95% predictive interval for the number of fatal accidents in 1986 under the assumption that 8 1011 passenger miles are flown that year.
(c) Repeat (a) above, replacing fatal accidents with passenger deaths.
(d) Repeat (b) above, replacing fatal accidents with passenger deaths.
Incidentally, in 1986, there were 22 fatal accidents, 546 passenger deaths, and a death rate of 0.06 per 100 million miles flown. We return to this example in Exercises 3.12, 6.2, 6.3, and 8.14.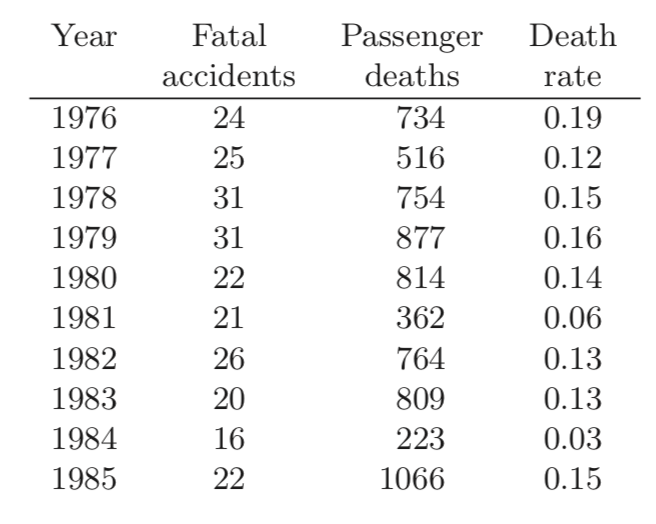
Step by Step Solution
There are 3 Steps involved in it
Step: 1

Get Instant Access to Expert-Tailored Solutions
See step-by-step solutions with expert insights and AI powered tools for academic success
Step: 2

Step: 3
Ace Your Homework with AI
Get the answers you need in no time with our AI-driven, step-by-step assistance
Get Started
International Finance For Dummies
Authors: Ayse Evrensel
1st Edition
111852389X, 978-1118523896