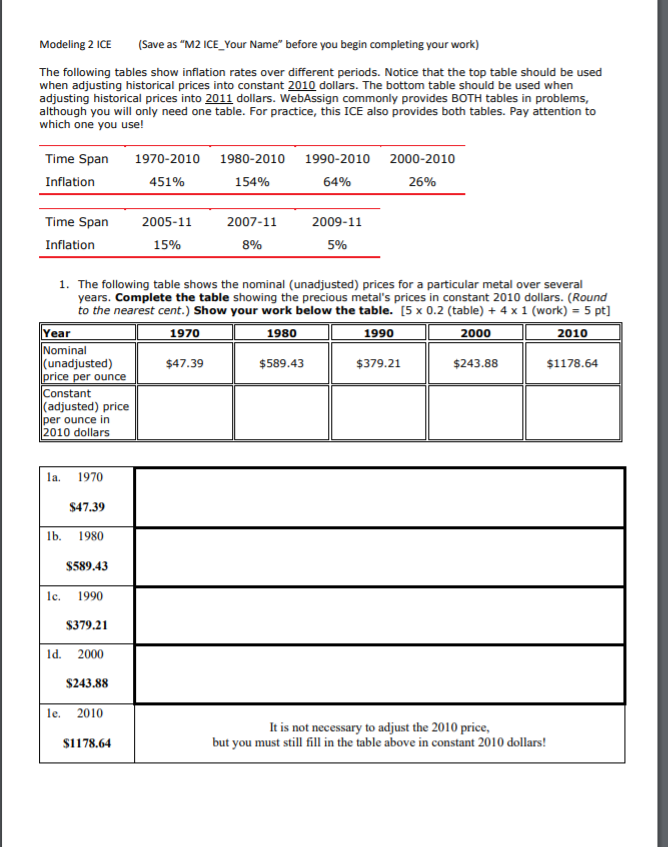
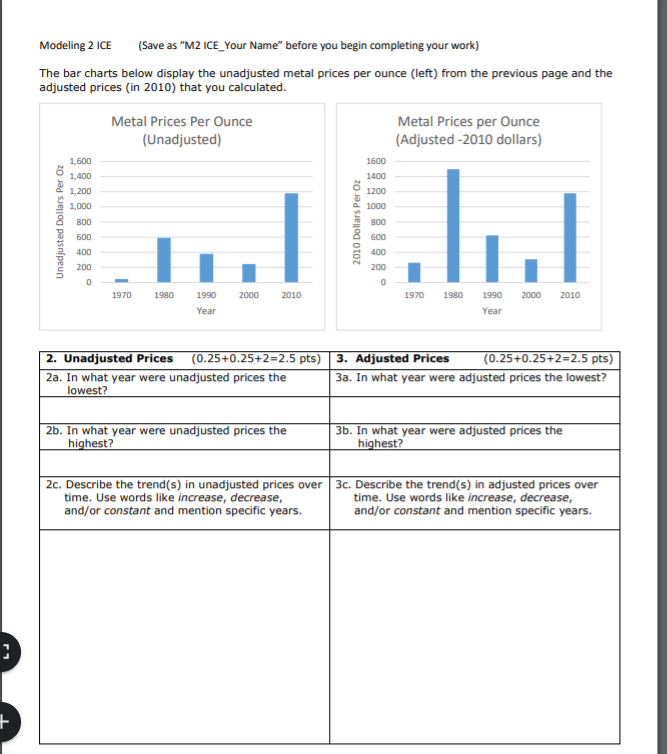
Modeling 2 ICE (Save as "M2 ICE_Your Name" before you begin completing your work) The following tables show inflation rates over different periods. Notice that the top table should be used when adjusting historical prices into constant 2010 dollars. The bottom table should be used when adjusting historical prices into 2011 dollars. WebAssign commonly provides BOTH tables in problems, although you will only need one table. For practice, this ICE also provides both tables. Pay attention to which one you use! Time Span Inflation 1970-2010 451% 1980-2010 1990-2010 2000-2010 154% 64% 26% Time Span Inflation 2005-11 15% 2007-11 8% 2009-11 5% 1. The following table shows the nominal (unadjusted) prices for a particular metal over several years. Complete the table showing the precious metal's prices in constant 2010 dollars. (Round to the nearest cent.) Show your work below the table. [5 x 0.2 (table) + 4 x 1 (work) = 5 pt] Year 1970 1980 1990 2000 2010 Nominal (unadjusted) $47.39 $589.43 $379.21 $243.88 $1178.64 price per ounce Constant (adjusted) price per ounce in 2010 dollars la. 1970 $47.39 1b. 1980 $589.43 Ic. 1990 $379.21 1d. 2000 $243.88 le. 2010 It is not necessary to adjust the 2010 price, but you must still fill in the table above in constant 2010 dollars! $1178.64 Modeling 2 ICE (Save as "M2 ICE_Your Name" before you begin completing your work) The bar charts below display the unadjusted metal prices per ounce (left) from the previous page and the adjusted prices in 2010) that you calculated. Metal Prices Per Ounce Metal Prices per Ounce (unadjusted) (Adjusted -2010 dollars) 1,600 1,400 1,200 Unadjusted Dollars Per Oz 1,000 800 1600 1400 1200 1000 800 600 400 200 0 600 400 200 0 1970 1980 1990 2000 2010 1970 1980 2000 2010 1990 Year Year 2. Unadjusted Prices (0.25+0.25+2=2.5 pts) 3. Adjusted Prices (0.25+0.25+2=2.5 pts) 2a. In what year were unadjusted prices the 3a. In what year were adjusted prices the lowest? lowest? 2b. In what year were unadjusted prices the highest? 3b. In what year were adjusted prices the highest? 2c. Describe the trend(s) in unadjusted prices over 3c. Describe the trend(s) in adjusted prices over time. Use words like increase, decrease, time. Use words like increase, decrease, and/or constant and mention specific years. and/or constant and mention specific years. r + Modeling 2 ICE (Save as "M2 ICE_Your Name" before you begin completing your work) The following tables show inflation rates over different periods. Notice that the top table should be used when adjusting historical prices into constant 2010 dollars. The bottom table should be used when adjusting historical prices into 2011 dollars. WebAssign commonly provides BOTH tables in problems, although you will only need one table. For practice, this ICE also provides both tables. Pay attention to which one you use! Time Span Inflation 1970-2010 451% 1980-2010 1990-2010 2000-2010 154% 64% 26% Time Span Inflation 2005-11 15% 2007-11 8% 2009-11 5% 1. The following table shows the nominal (unadjusted) prices for a particular metal over several years. Complete the table showing the precious metal's prices in constant 2010 dollars. (Round to the nearest cent.) Show your work below the table. [5 x 0.2 (table) + 4 x 1 (work) = 5 pt] Year 1970 1980 1990 2000 2010 Nominal (unadjusted) $47.39 $589.43 $379.21 $243.88 $1178.64 price per ounce Constant (adjusted) price per ounce in 2010 dollars la. 1970 $47.39 1b. 1980 $589.43 Ic. 1990 $379.21 1d. 2000 $243.88 le. 2010 It is not necessary to adjust the 2010 price, but you must still fill in the table above in constant 2010 dollars! $1178.64 Modeling 2 ICE (Save as "M2 ICE_Your Name" before you begin completing your work) The bar charts below display the unadjusted metal prices per ounce (left) from the previous page and the adjusted prices in 2010) that you calculated. Metal Prices Per Ounce Metal Prices per Ounce (unadjusted) (Adjusted -2010 dollars) 1,600 1,400 1,200 Unadjusted Dollars Per Oz 1,000 800 1600 1400 1200 1000 800 600 400 200 0 600 400 200 0 1970 1980 1990 2000 2010 1970 1980 2000 2010 1990 Year Year 2. Unadjusted Prices (0.25+0.25+2=2.5 pts) 3. Adjusted Prices (0.25+0.25+2=2.5 pts) 2a. In what year were unadjusted prices the 3a. In what year were adjusted prices the lowest? lowest? 2b. In what year were unadjusted prices the highest? 3b. In what year were adjusted prices the highest? 2c. Describe the trend(s) in unadjusted prices over 3c. Describe the trend(s) in adjusted prices over time. Use words like increase, decrease, time. Use words like increase, decrease, and/or constant and mention specific years. and/or constant and mention specific years. r +