

Answered step by step
Verified Expert Solution
Question
1 Approved Answer
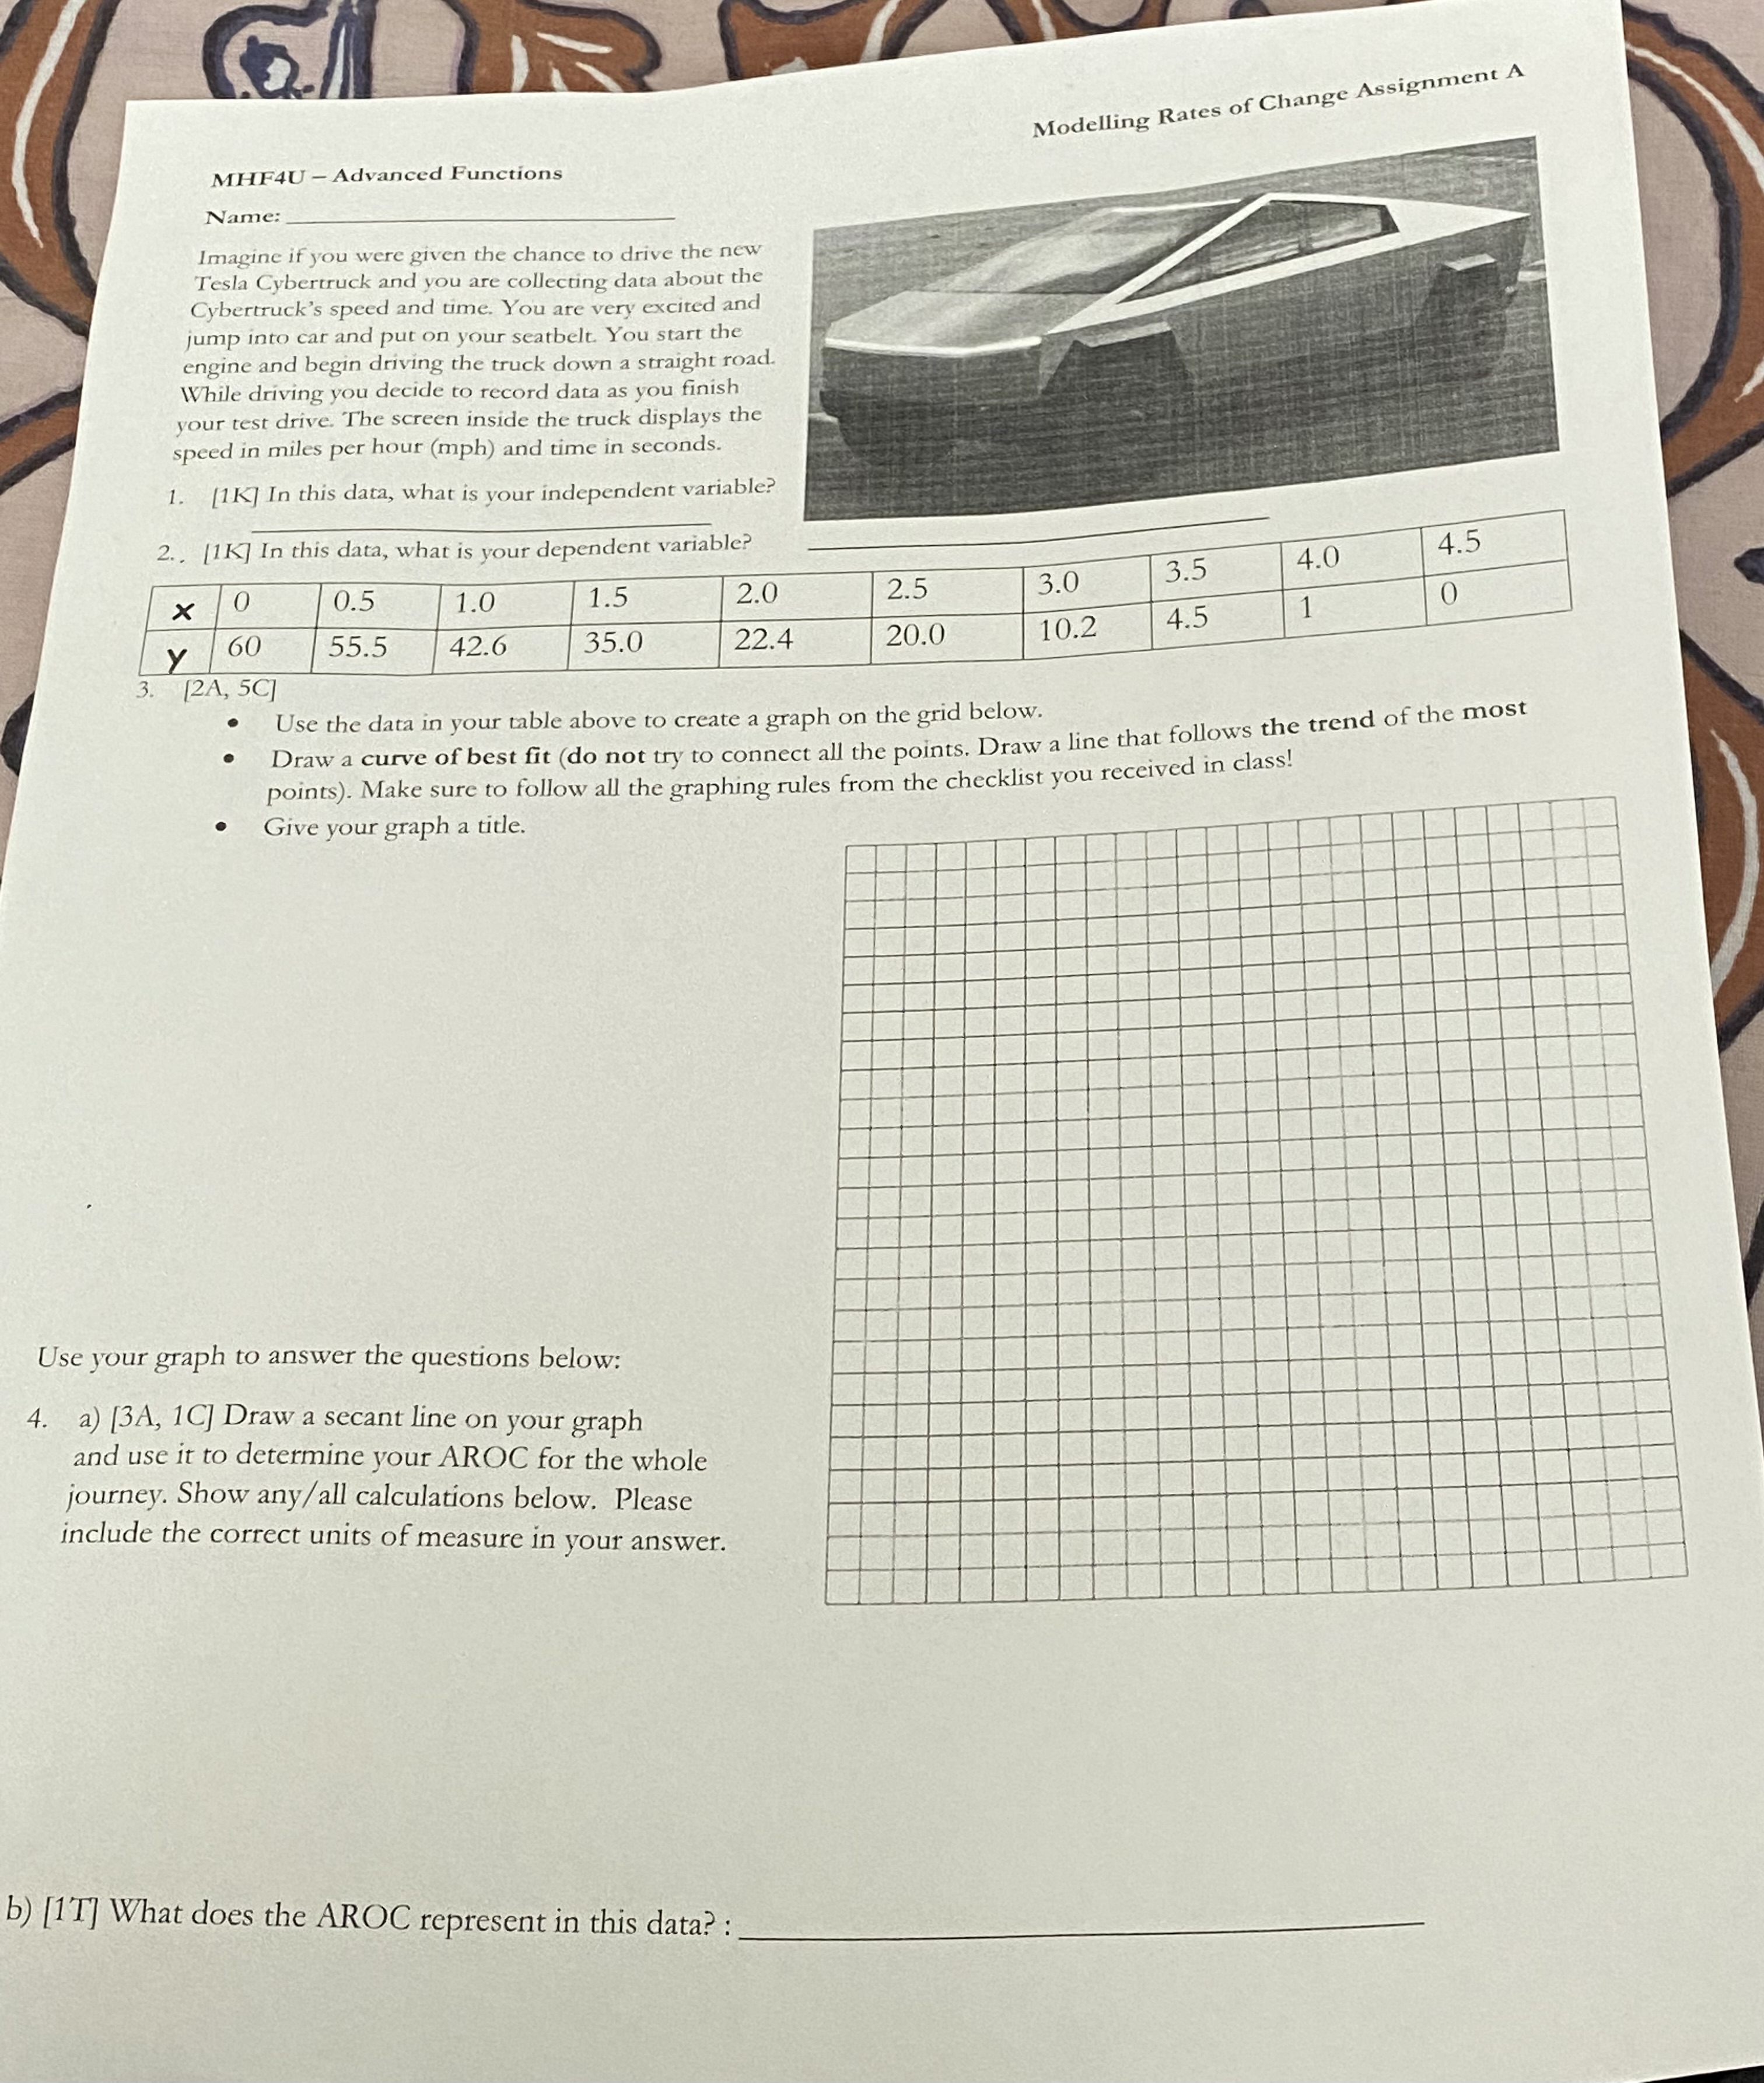
Modelling Rates of Change Assignment A MHF4U - Advanced Functions Name: Imagine if you were given the chance to drive the new Tesla Cybertruck and


Step by Step Solution
There are 3 Steps involved in it
Step: 1

Get Instant Access to Expert-Tailored Solutions
See step-by-step solutions with expert insights and AI powered tools for academic success
Step: 2

Step: 3
Ace Your Homework with AI
Get the answers you need in no time with our AI-driven, step-by-step assistance
Get Started
Concepts In Set Theory
Authors: Mofidul Islam
1st Edition
9353146232, 9789353146238