

Answered step by step
Verified Expert Solution
Question
1 Approved Answer
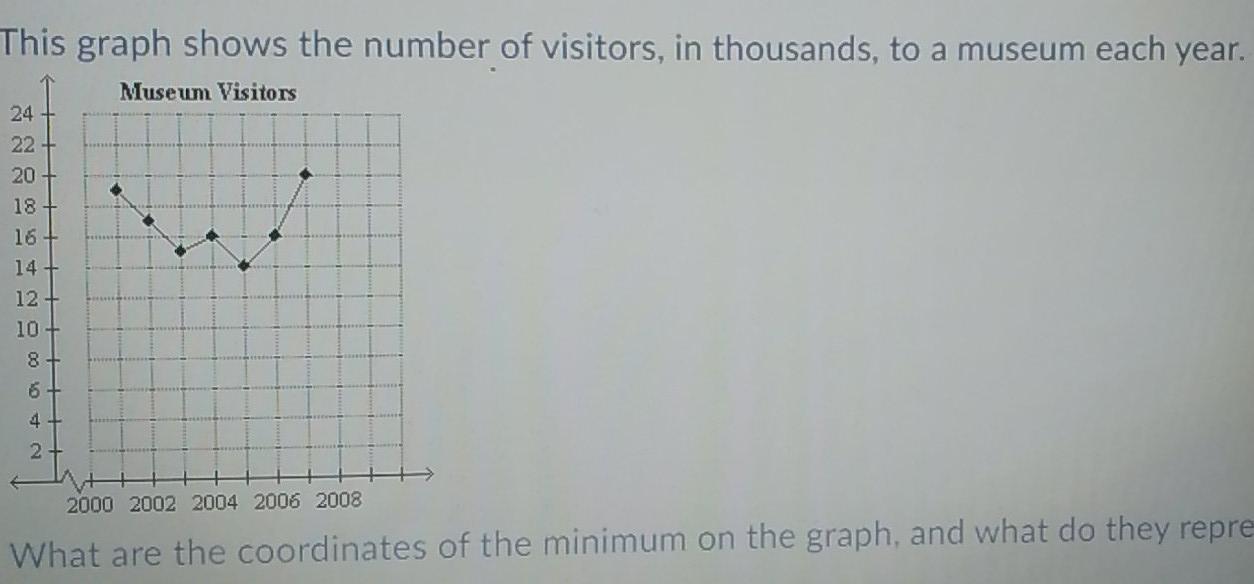
models Annuity This graph shows the number of visitors, in thousands, to a museum each year. Museum Visitors 24 22 20 18 16 14 12
models Annuity
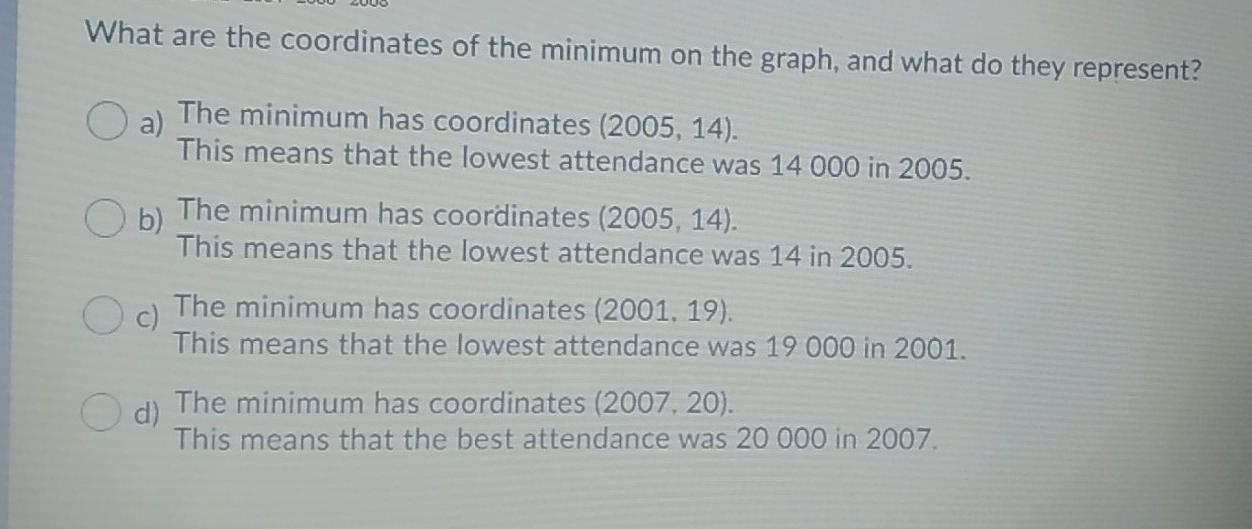
This graph shows the number of visitors, in thousands, to a museum each year. Museum Visitors 24 22 20 18 16 14 12 10 8 6 4 2 2000 2002 2004 2006 2008 What are the coordinates of the minimum on the graph, and what do they repre What are the coordinates of the minimum on the graph, and what do they represent? a) The minimum has coordinates (2005, 14). This means that the lowest attendance was 14 000 in 2005. Ob) The minimum has coordinates (2005, 14). This means that the lowest attendance was 14 in 2005. c) The minimum has coordinates (2001, 19). This means that the lowest attendance was 19 000 in 2001. O d) The minimum has coordinates (2007. 20). This means that the best attendance was 20 000 in 2007Step by Step Solution
There are 3 Steps involved in it
Step: 1

Get Instant Access to Expert-Tailored Solutions
See step-by-step solutions with expert insights and AI powered tools for academic success
Step: 2

Step: 3
Ace Your Homework with AI
Get the answers you need in no time with our AI-driven, step-by-step assistance
Get Started
The Cyber Attack Survival Manual
Authors: Heather Vescent ,Nick Selby
1st Edition
1681886545, 978-1681886541