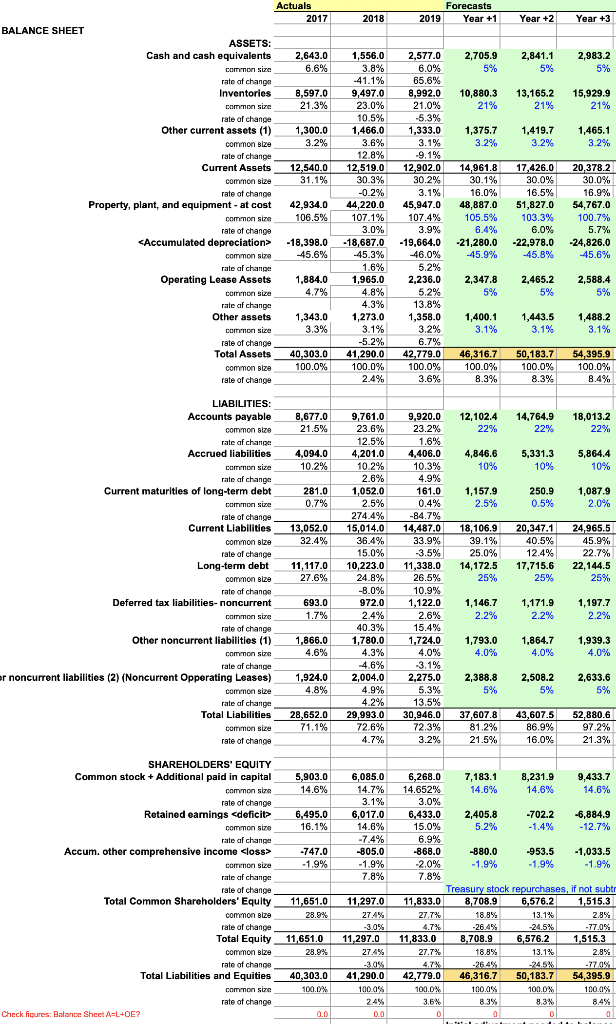
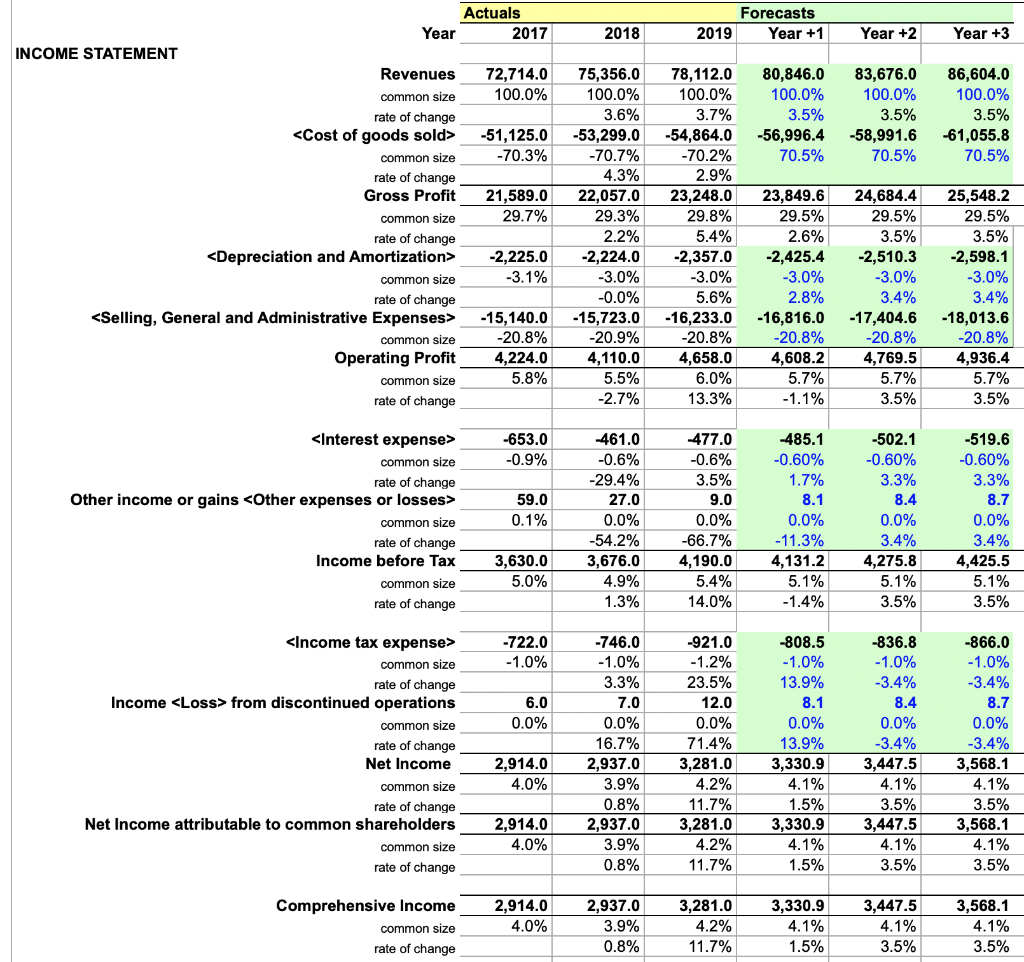
Modify projections (attached images) for Target Corporation for the coming year to show best- and worst-case scenario based on potential success factors and risks.
---Success Factors: maintaining and increasing their liquidity and balancing it with their debts, With their ample sources of liquidity, the company is in a position to be able to continue current operations while funding expansion and other strategic initiatives, addressing their long-term plans of being a stable and financially responsible company that has the ability to continually work towards customer satisfaction. The company puts more efforts into responding to public perceptions and feedback and maintaining their financial responsibility and liquidity puts them in a better position to continually quickly react and make changes within the company. company has put a large amount of their finances towards remodeling their existing stores, since 2017 they've remodeled over 700 stores, with plans to remodel 300 in 2020, then around 150 each year starting in 2021. The company has also put emphasis in expanding their owned and exclusive brands to further increase profits, give consumers lower prices, and draw customers to their stores
---Risks: Target has identified several internal risks the company must account for in their business in the following categories: competitive/reputational risks, investment/infrastructure risks, information security/cyber security/data privacy risks, supply chain/third-party risks, and financial risks. . If Target does not take care to listen to public opinion, or quickly manage negative perceptions from customers the company could suffer from decreased sales and employee retention and recruiting difficulties. Target recognizes the need to move their business into new channels, including ecommerce, in order to remain competitive in the retail industry and keep customers satisfied. ). Growth in sales taking place through online pick-up orders, online delivery orders, and orders through Targets subsidiary Shipt for grocery deliver has significantly increased in recent years. If the company does not keep focus on expanding their digital channels it has great potential to hurt their sales amounts


Actuals 2017 2018 Forecasts 2019 Year +1 Year +2 Year +3 BALANCE SHEET ASSETS: Cash and cash equivalents 2,841.1 2,643.0 6.6% 2,705.9 5% 2,983.2 5% Como in 5% 8,597.0 21.3% 10,880.3 21% 13,165.2 21% 15,929.9 21% 1,300.0 3.2% 1,375.7 3.2% 1,419.7 3.2% 1,465.1 3.2% 12,540.0 31.1% 42,934.0 106.5% rate of change Inventories common size rate of change Other current assets (1) common size rate of change Current Assets common size rate of change Property, plant, and equipment - at cost common size rate of change
common size rate of change Operating Lease Assets common size rate of change Other assets Cominon size rate of change Total Assets common size rate of change 1,556.0 3.8% -41.1% 9,497.0 23.0% 10.5% 1,466.0 3.6% 12.8% 12,519.0 30.3% -0.2% 44.220.0 107.1% 3.0% -18,687.0 -45.3% 1.6% 1,965.0 4.8% 4.3% 1,273.0 3.1% -5.2% 41,290.0 100.0% 2.4% 2,577.0 6.0% 65.6% 8,992.0 21.0% -5.3% 1,333.0 3.1% -9.1% 12,902.0 30.2% 3.1% 45,947.0 107.4% 3.9% -19,664.0 -46.0% 5.2% 2,236.0 5.2% 13.8% 1,358.0 3.2% 6.7% 42.779.0 100.0% 3.6% 14,961.6 30.1% 16.0% 48,887.0 105.5% 6.4% -21,280.0 -45.9% 17,426.0 30.0% 16.5% 51,827.0 103.3% 6.0% -22,978.0 -45.8% 20,378.2 30.0% 16.9% 54,767.0 100.7% 5.7% -24,826.0 -45.6% -18,398.0 45.6% 1,884.0 4.7% 2,347.8 5% 2,465.2 5% 2,588.4 5% 1,343.0 3.3% 1,400.1 3.1% 1,443.5 3.1% 1,488.2 3.1% 40,303.0 100.0% 46,316.7 100.0% 8.3% 50,183.7 100.0% 8.3% 54,395.9 100.0% 8.4% 8,677.0 21.5% 12,102.4 22% 14,764.9 22% 18,013.2 22% 4,094.0 10.2% 4,846.6 10% 5,331.3 10% 5,864.4 10% 9,920.0 23.2% 1.6% 4,406.0 10.3% 4.9% 161.0 0.4% -84.7% 14,487.0 281.0 0.7% 1,157.9 2.5% 250.9 0.5% 1,087.9 2.0% 24,965.5 13,052.0 32.4% 33.9% 45.9% LIABILITIES: Accounts payable common size rate of change Accrued liabilities Common size rate of change Current maturities of long-term debt common size rate of change Current Liabilities common Bize rate of change Long-term debt common Blze rate of change Deferred tax liabilities- noncurrent common size rate of change Other noncurrent liabilities (1) common size rate of change er noncurrent liabilities (2) (Noncurrent Opperating Leases) common size rate of change Total Liabilities common size rate of change 9,761.0 23.6% 12.5% 4,201.0 10.2% 2.6% 1,052.0 2.5% 274.4% 15,014.0 36.4% 15.0% 10,223.0 24.8% -8.0% 972.0 2.4% 40.3% 1,780.0 4.3% 4.6% 2,004.0 4.9% 4.2% 29,993.0 72.6% 4.7% 18,106.9 39.1% 25.0% 14,172.5 25% 20,347.1 40.5% 12.4% 17,715.6 25% 11, 117.0 27.6% 22.7% 22,144.5 25% 693.0 1.7% 1,146.7 2.2% 1,171.9 2.2% 1,197.7 2.2% 1,864.7 1,866.0 4.6% 3.5% 11,338.0 26.5% 10.9% 1,122.0 2.6% 15.4% 1,724.0 4.0% -3.1% 2,275.0 5.3% 13.5% 30,946.0 72.3% 3.2% 1,793.0 4.0% 1,939.3 4.0% 4.0% 1,924.0 4.8% 2,633.6 2,388.8 5% 2,508.2 5% 5% 28,652.0 71.1% 37,607.8 81.2% 21.5% 43,607.5 86.9% 16.0% 52.880.6 97.2% 21.3% 5,903.0 14.6% 7.183.1 14.6% 8,231.9 14.6% 9,433.7 14.6% 6,495.0 16.1% 6,085.0 14.7% 3.1% 6,017.0 14.6% -7.4% -805.0 -1.9% 7.8% 6,268.0 14.652% 3.0% 6,433.0 15.0% 6.9% -868.0 -2.0% 7.8% 2,405.8 5.2% -702.2 -1.4% -6,884.9 -12.7% -747.0 -1.9% -880.0 -1.9% -953.5 -1.9% -1,033,5 -1.9% SHAREHOLDERS' EQUITY Common stock + Additional paid in capital common size rate of change Retained earnings -51,125.0 common size -70.3% rate of change Gross Profit 21,589.0 common size 29.7% rate of change -2,225.0 common size -3.1% rate of change -15,140.0 common size -20.8% Operating Profit 4,224.0 common size 5.8% rate of change 75,356.0 100.0% 3.6% -53,299.0 -70.7% 4.3% 22.057.0 29.3% 2.2% -2,224.0 -3.0% -0.0% -15,723.0 -20.9% 4,110.0 5.5% -2.7% 78,112.0 100.0% 3.7% -54,864.0 -70.2% 2.9% 23,248.0 29.8% 5.4% -2,357.0 -3.0% 5.6% -16,233.0 -20.8% 4,658.0 6.0% 13.3% 23,849.6 29.5% 2.6% -2,425.4 -3.0% 2.8% -16,816.0 -20.8% 4,608.2 5.7% -1.1% 24,684.4 29.5% 3.5% -2,510.3 -3.0% 3.4% -17,404.6 -20.8% 4,769.5 5.7% 3.5% 25,548.2 29.5% 3.5% -2,598.1 -3.0% 3.4% -18,013.6 -20.8% 4,936.4 5.7% 3.5% -653.0 -0.9% common size rate of change Income before Tax common size rate of change 59.0 0.1% -461.0 -0.6% -29.4% 27.0 0.0% -54.2% 3,676.0 4.9% 1.3% -477.0 -0.6% 3.5% 9.0 0.0% -66.7% 4,190.0 5.4% 14.0% -485.1 -0.60% 1.7% 8.1 0.0% -11.3% 4,131.2 -502.1 -0.60% 3.3% 8.4 0.0% 3.4% 4,275.8 5.1% 3.5% -519.6 -0.60% 3.3% 8.7 0.0% 3.4% 4,425.5 5.1% 3.5% 3,630.0 5.0% 5.1% -1.4% -722.0 -1.0% 6.0 0.0% from discontinued operations common size rate of change Net Income common size rate of change Net Income attributable to common shareholders common size rate of change -746.0 -1.0% 3.3% 7.0 0.0% 16.7% 2,937.0 3.9% 0.8% 2,937.0 3.9% 0.8% -921.0 -1.2% 23.5% 12.0 0.0% 71.4% 3,281.0 4.2% 11.7% 3,281.0 4.2% 11.7% -808.5 -1.0% 13.9% 8.1 0.0% 13.9% 3,330.9 4.1% 1.5% 3,330.9 4.1% 1.5% -836.8 -1.0% -3.4% 8.4 0.0% -3.4% 3,447.5 4.1% -866.0 -1.0% -3.4% 8.7 0.0% -3.4% 3,568.1 4.1% 3.5% 3,568.1 4.1% 3.5% 2,914.0 4.0% 3.5% 2,914.0 4.0% 3,447.5 4.1% 3.5% Comprehensive Income common size rate of change 2,914.0 4.0% 2,937.0 3.9% 0.8% 3,281.0 4.2% 11.7% 3,330.9 4.1% 1.5% 3,447.5 4.1% 3.5% 3,568.1 4.1% 3.5% Actuals 2017 2018 Forecasts 2019 Year +1 Year +2 Year +3 BALANCE SHEET ASSETS: Cash and cash equivalents 2,841.1 2,643.0 6.6% 2,705.9 5% 2,983.2 5% Como in 5% 8,597.0 21.3% 10,880.3 21% 13,165.2 21% 15,929.9 21% 1,300.0 3.2% 1,375.7 3.2% 1,419.7 3.2% 1,465.1 3.2% 12,540.0 31.1% 42,934.0 106.5% rate of change Inventories common size rate of change Other current assets (1) common size rate of change Current Assets common size rate of change Property, plant, and equipment - at cost common size rate of change common size rate of change Operating Lease Assets common size rate of change Other assets Cominon size rate of change Total Assets common size rate of change 1,556.0 3.8% -41.1% 9,497.0 23.0% 10.5% 1,466.0 3.6% 12.8% 12,519.0 30.3% -0.2% 44.220.0 107.1% 3.0% -18,687.0 -45.3% 1.6% 1,965.0 4.8% 4.3% 1,273.0 3.1% -5.2% 41,290.0 100.0% 2.4% 2,577.0 6.0% 65.6% 8,992.0 21.0% -5.3% 1,333.0 3.1% -9.1% 12,902.0 30.2% 3.1% 45,947.0 107.4% 3.9% -19,664.0 -46.0% 5.2% 2,236.0 5.2% 13.8% 1,358.0 3.2% 6.7% 42.779.0 100.0% 3.6% 14,961.6 30.1% 16.0% 48,887.0 105.5% 6.4% -21,280.0 -45.9% 17,426.0 30.0% 16.5% 51,827.0 103.3% 6.0% -22,978.0 -45.8% 20,378.2 30.0% 16.9% 54,767.0 100.7% 5.7% -24,826.0 -45.6% -18,398.0 45.6% 1,884.0 4.7% 2,347.8 5% 2,465.2 5% 2,588.4 5% 1,343.0 3.3% 1,400.1 3.1% 1,443.5 3.1% 1,488.2 3.1% 40,303.0 100.0% 46,316.7 100.0% 8.3% 50,183.7 100.0% 8.3% 54,395.9 100.0% 8.4% 8,677.0 21.5% 12,102.4 22% 14,764.9 22% 18,013.2 22% 4,094.0 10.2% 4,846.6 10% 5,331.3 10% 5,864.4 10% 9,920.0 23.2% 1.6% 4,406.0 10.3% 4.9% 161.0 0.4% -84.7% 14,487.0 281.0 0.7% 1,157.9 2.5% 250.9 0.5% 1,087.9 2.0% 24,965.5 13,052.0 32.4% 33.9% 45.9% LIABILITIES: Accounts payable common size rate of change Accrued liabilities Common size rate of change Current maturities of long-term debt common size rate of change Current Liabilities common Bize rate of change Long-term debt common Blze rate of change Deferred tax liabilities- noncurrent common size rate of change Other noncurrent liabilities (1) common size rate of change er noncurrent liabilities (2) (Noncurrent Opperating Leases) common size rate of change Total Liabilities common size rate of change 9,761.0 23.6% 12.5% 4,201.0 10.2% 2.6% 1,052.0 2.5% 274.4% 15,014.0 36.4% 15.0% 10,223.0 24.8% -8.0% 972.0 2.4% 40.3% 1,780.0 4.3% 4.6% 2,004.0 4.9% 4.2% 29,993.0 72.6% 4.7% 18,106.9 39.1% 25.0% 14,172.5 25% 20,347.1 40.5% 12.4% 17,715.6 25% 11, 117.0 27.6% 22.7% 22,144.5 25% 693.0 1.7% 1,146.7 2.2% 1,171.9 2.2% 1,197.7 2.2% 1,864.7 1,866.0 4.6% 3.5% 11,338.0 26.5% 10.9% 1,122.0 2.6% 15.4% 1,724.0 4.0% -3.1% 2,275.0 5.3% 13.5% 30,946.0 72.3% 3.2% 1,793.0 4.0% 1,939.3 4.0% 4.0% 1,924.0 4.8% 2,633.6 2,388.8 5% 2,508.2 5% 5% 28,652.0 71.1% 37,607.8 81.2% 21.5% 43,607.5 86.9% 16.0% 52.880.6 97.2% 21.3% 5,903.0 14.6% 7.183.1 14.6% 8,231.9 14.6% 9,433.7 14.6% 6,495.0 16.1% 6,085.0 14.7% 3.1% 6,017.0 14.6% -7.4% -805.0 -1.9% 7.8% 6,268.0 14.652% 3.0% 6,433.0 15.0% 6.9% -868.0 -2.0% 7.8% 2,405.8 5.2% -702.2 -1.4% -6,884.9 -12.7% -747.0 -1.9% -880.0 -1.9% -953.5 -1.9% -1,033,5 -1.9% SHAREHOLDERS' EQUITY Common stock + Additional paid in capital common size rate of change Retained earnings -51,125.0 common size -70.3% rate of change Gross Profit 21,589.0 common size 29.7% rate of change -2,225.0 common size -3.1% rate of change -15,140.0 common size -20.8% Operating Profit 4,224.0 common size 5.8% rate of change 75,356.0 100.0% 3.6% -53,299.0 -70.7% 4.3% 22.057.0 29.3% 2.2% -2,224.0 -3.0% -0.0% -15,723.0 -20.9% 4,110.0 5.5% -2.7% 78,112.0 100.0% 3.7% -54,864.0 -70.2% 2.9% 23,248.0 29.8% 5.4% -2,357.0 -3.0% 5.6% -16,233.0 -20.8% 4,658.0 6.0% 13.3% 23,849.6 29.5% 2.6% -2,425.4 -3.0% 2.8% -16,816.0 -20.8% 4,608.2 5.7% -1.1% 24,684.4 29.5% 3.5% -2,510.3 -3.0% 3.4% -17,404.6 -20.8% 4,769.5 5.7% 3.5% 25,548.2 29.5% 3.5% -2,598.1 -3.0% 3.4% -18,013.6 -20.8% 4,936.4 5.7% 3.5% -653.0 -0.9% common size rate of change Income before Tax common size rate of change 59.0 0.1% -461.0 -0.6% -29.4% 27.0 0.0% -54.2% 3,676.0 4.9% 1.3% -477.0 -0.6% 3.5% 9.0 0.0% -66.7% 4,190.0 5.4% 14.0% -485.1 -0.60% 1.7% 8.1 0.0% -11.3% 4,131.2 -502.1 -0.60% 3.3% 8.4 0.0% 3.4% 4,275.8 5.1% 3.5% -519.6 -0.60% 3.3% 8.7 0.0% 3.4% 4,425.5 5.1% 3.5% 3,630.0 5.0% 5.1% -1.4% -722.0 -1.0% 6.0 0.0% from discontinued operations common size rate of change Net Income common size rate of change Net Income attributable to common shareholders common size rate of change -746.0 -1.0% 3.3% 7.0 0.0% 16.7% 2,937.0 3.9% 0.8% 2,937.0 3.9% 0.8% -921.0 -1.2% 23.5% 12.0 0.0% 71.4% 3,281.0 4.2% 11.7% 3,281.0 4.2% 11.7% -808.5 -1.0% 13.9% 8.1 0.0% 13.9% 3,330.9 4.1% 1.5% 3,330.9 4.1% 1.5% -836.8 -1.0% -3.4% 8.4 0.0% -3.4% 3,447.5 4.1% -866.0 -1.0% -3.4% 8.7 0.0% -3.4% 3,568.1 4.1% 3.5% 3,568.1 4.1% 3.5% 2,914.0 4.0% 3.5% 2,914.0 4.0% 3,447.5 4.1% 3.5% Comprehensive Income common size rate of change 2,914.0 4.0% 2,937.0 3.9% 0.8% 3,281.0 4.2% 11.7% 3,330.9 4.1% 1.5% 3,447.5 4.1% 3.5% 3,568.1 4.1% 3.5%


