

Question
Modify the program from Lab 6 that displays the NYC historical population data. Your program should ask the user for the borough, an name for
Modify the program from Lab 6 that displays the NYC historical population data. Your program should ask the user for the borough, an name for the output file, and then display the fraction of the population that has lived in that borough, over time.
A sample run of the program:
Enter borough name: Queens Enter output file name: qFraction.png
The file qFraction.png:
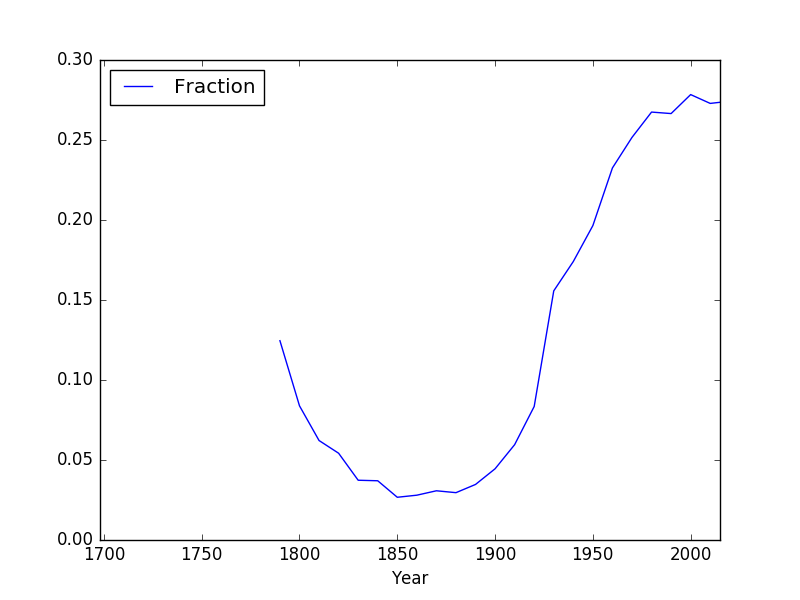
Note: before submitting your program for grading, remove the commands that show the image (i.e. the ones that pop up the graphics window with the image). The program is graded on a server on the cloud and does not have a graphics window, so, the plt.show() and plt.imshow() commands will give an error. Instead, the files your program produces are compared pixel-by-pixel to the answer to check for correctness.
0.30 Fraction 0.25 0.20 0.15 0.10 0.05 0700 1750 1800 18501900 1950 2000 0.00 Year 0.30 Fraction 0.25 0.20 0.15 0.10 0.05 0700 1750 1800 18501900 1950 2000 0.00 YearStep by Step Solution
There are 3 Steps involved in it
Step: 1

Get Instant Access to Expert-Tailored Solutions
See step-by-step solutions with expert insights and AI powered tools for academic success
Step: 2

Step: 3
Ace Your Homework with AI
Get the answers you need in no time with our AI-driven, step-by-step assistance
Get Started
Database Theory Icdt 97 6th International Conference Delphi Greece January 8 10 1997 Proceedings Lncs 1186
Authors: Foto N. Afrati ,Phokion G. Kolaitis
1st Edition
3540622225, 978-3540622222