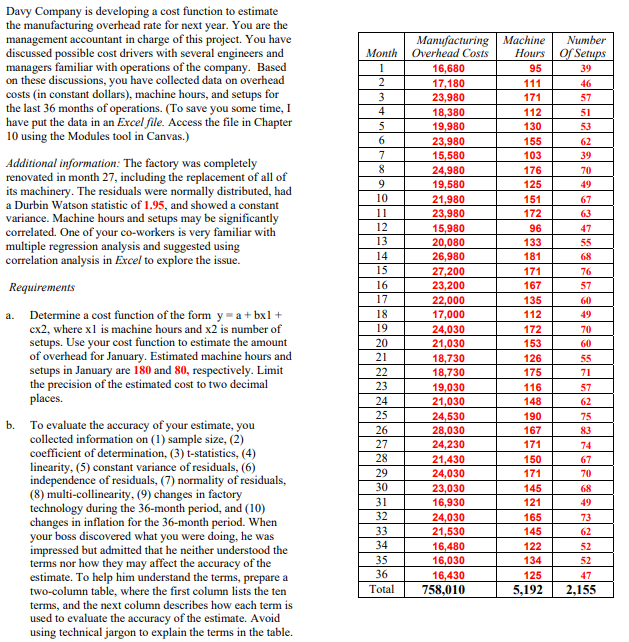
Month Davy Company is developing a cost function to estimate the manufacturing overhead rate for next year. You are the management accountant in charge of this project. You have discussed possible cost drivers with several engineers and managers familiar with operations of the company. Based on these discussions, you have collected data on overhead costs in constant dollars), machine hours, and setups for the last 36 months of operations. (To save you some time, I have put the data in an Excel file. Access the file in Chapter 10 using the Modules tool in Canvas.) 2 3 Machine Machine Number Hours of Setups 39 111 171 112 130 155 103 176 125 6 151 Additional information: The factory was completely renovated in month 27, including the replacement of all of its machinery. The residuals were normally distributed, had a Durbin Watson statistic of 1.95, and showed a constant variance. Machine hours and setups may be significantly correlated. One of your co-workers is very familiar with multiple regression analysis and suggested using correlation analysis in Excel to explore the issue. 172 96 13 133 181 14 15 Requirements 171 167 135 112 a. Manufacturing Overhead Costs 16,680 17,180 23,980 18,380 19,980 23,980 15,580 24,980 19,580 21,980 23,980 15,980 20,080 26,980 27,200 23,200 22,000 17,000 24,030 21,030 18,730 18,730 19,030 21,030 24,530 28,030 24,230 21,430 24,030 23,030 16,930 24,030 21,530 16,480 16,030 16,430 758,010 Determine a cost function of the form y = a + bxl + cx2, where xl is machine hours and X2 is number of setups. Use your cost function to estimate the amount of overhead for January. Estimated machine hours and setups in January are 180 and 80, respectively. Limit the precision of the estimated cost to two decimal places. 172 153 126 175 116 148 190 b. 167 171 150 171 To evaluate the accuracy of your estimate, you collected information on (1) sample size, (2) coefficient of determination, (3) t-statistics, (4) linearity, (5) constant variance of residuals, (6) independence of residuals, (7) normality of residuals, (8) multi-collinearity, (9) changes in factory technology during the 36-month period, and (10) changes in inflation for the 36-month period. When your boss discovered what you were doing, he was impressed but admitted that he neither understood the terms nor how they may affect the accuracy of the estimate. To help him understand the terms, prepare a two-column table, where the first column lists the ten terms, and the next column describes how each term is used to evaluate the accuracy of the estimate. Avoid using technical jargon to explain the terms in the table. 145 121 165 145 122 134 125 5,192 35 Total 2,155 Month Davy Company is developing a cost function to estimate the manufacturing overhead rate for next year. You are the management accountant in charge of this project. You have discussed possible cost drivers with several engineers and managers familiar with operations of the company. Based on these discussions, you have collected data on overhead costs in constant dollars), machine hours, and setups for the last 36 months of operations. (To save you some time, I have put the data in an Excel file. Access the file in Chapter 10 using the Modules tool in Canvas.) 2 3 Machine Machine Number Hours of Setups 39 111 171 112 130 155 103 176 125 6 151 Additional information: The factory was completely renovated in month 27, including the replacement of all of its machinery. The residuals were normally distributed, had a Durbin Watson statistic of 1.95, and showed a constant variance. Machine hours and setups may be significantly correlated. One of your co-workers is very familiar with multiple regression analysis and suggested using correlation analysis in Excel to explore the issue. 172 96 13 133 181 14 15 Requirements 171 167 135 112 a. Manufacturing Overhead Costs 16,680 17,180 23,980 18,380 19,980 23,980 15,580 24,980 19,580 21,980 23,980 15,980 20,080 26,980 27,200 23,200 22,000 17,000 24,030 21,030 18,730 18,730 19,030 21,030 24,530 28,030 24,230 21,430 24,030 23,030 16,930 24,030 21,530 16,480 16,030 16,430 758,010 Determine a cost function of the form y = a + bxl + cx2, where xl is machine hours and X2 is number of setups. Use your cost function to estimate the amount of overhead for January. Estimated machine hours and setups in January are 180 and 80, respectively. Limit the precision of the estimated cost to two decimal places. 172 153 126 175 116 148 190 b. 167 171 150 171 To evaluate the accuracy of your estimate, you collected information on (1) sample size, (2) coefficient of determination, (3) t-statistics, (4) linearity, (5) constant variance of residuals, (6) independence of residuals, (7) normality of residuals, (8) multi-collinearity, (9) changes in factory technology during the 36-month period, and (10) changes in inflation for the 36-month period. When your boss discovered what you were doing, he was impressed but admitted that he neither understood the terms nor how they may affect the accuracy of the estimate. To help him understand the terms, prepare a two-column table, where the first column lists the ten terms, and the next column describes how each term is used to evaluate the accuracy of the estimate. Avoid using technical jargon to explain the terms in the table. 145 121 165 145 122 134 125 5,192 35 Total 2,155