Answered step by step
Verified Expert Solution
Question
1 Approved Answer
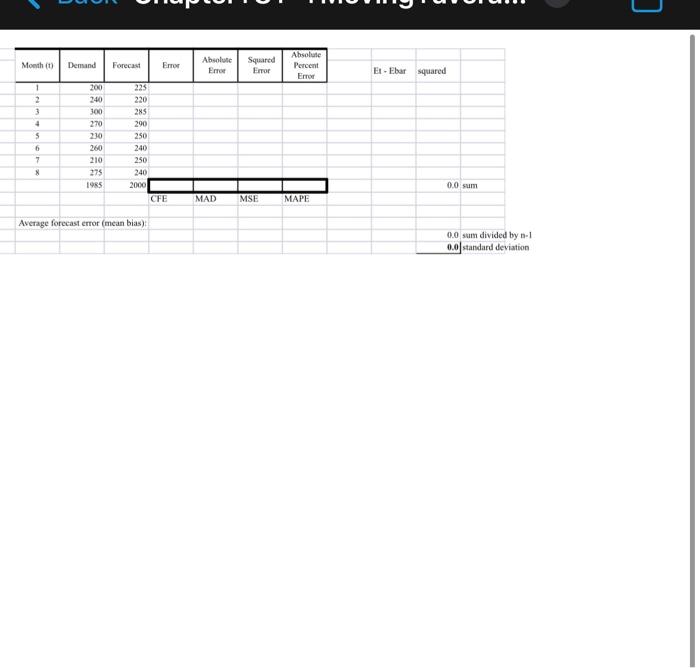
Month (t) Demand 1 2 3 4 5 6 7 8 200 240 300 270 230 260 210 275 1985. Forecast 225 220 285 290
Month (t) Demand 1 2 3 4 5 6 7 8 200 240 300 270 230 260 210 275 1985. Forecast 225 220 285 290 250 240 250 240 2000 Average forecast error (mean bias): Error CFE Absolute Squared Error Error MAD MSE Absolute. Percent Error MAPE Et - Ebar squared 0.0 sum 0.0 sum divided by n-1 0.0 standard deviation ]

Step by Step Solution
There are 3 Steps involved in it
Step: 1

Get Instant Access to Expert-Tailored Solutions
See step-by-step solutions with expert insights and AI powered tools for academic success
Step: 2

Step: 3

Ace Your Homework with AI
Get the answers you need in no time with our AI-driven, step-by-step assistance
Get Started


