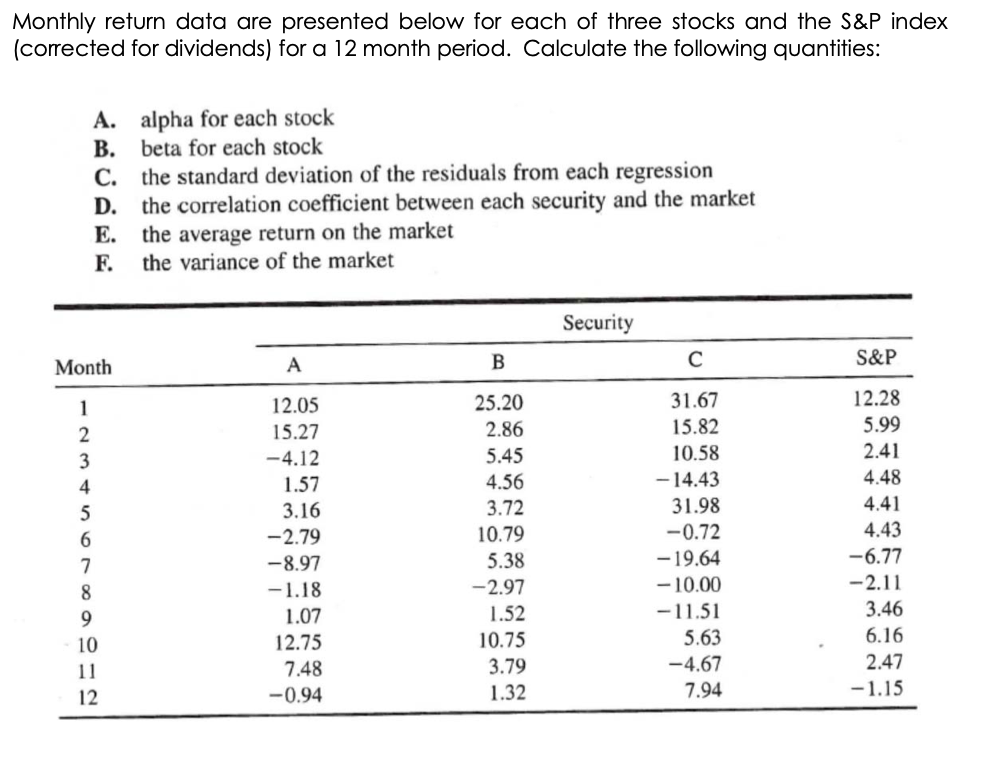
Monthly return data are presented below for each of three stocks and the S&P index (corrected for dividends) for a 12 month period. Calculate the following quantities: A. alpha for each stock B. beta for each stock c. the standard deviation of the residuals from each regression D. the correlation coefficient between each security and the market E. the average return on the market F. the variance of the market Security Month A B S&P 1 2 3 4 5 6 7 8 9 10 11 12 12.05 15.27 -4.12 1.57 3.16 -2.79 -8.97 -1.18 1.07 12.75 7.48 -0.94 25.20 2.86 5.45 4.56 3.72 10.79 5.38 -2.97 1.52 10.75 3.79 1.32 31.67 15.82 10.58 - 14.43 31.98 -0.72 - 19.64 - 10.00 -11.51 5.63 -4.67 7.94 12.28 5.99 2.41 4.48 4.41 4.43 -6.77 -2.11 3.46 6.16 2.47 -1.15 A. Compute the mean return and variance of return for each stock in Problem 1 using (1) The single-index model (2) The historical data B. Compute the covariance between each possible pair of stocks using (1) The single-index model (2) The historical data C. Compute the return and standard deviation of a portfolio constructed by placing one-third of your funds in each stock, using (1) The single-index model (2) The historical data D. Explain why the answers to parts A.1 and A.2 were the same, while the answers to parts B.1, B.2, and C.1, C.2 were different. Monthly return data are presented below for each of three stocks and the S&P index (corrected for dividends) for a 12 month period. Calculate the following quantities: A. alpha for each stock B. beta for each stock c. the standard deviation of the residuals from each regression D. the correlation coefficient between each security and the market E. the average return on the market F. the variance of the market Security Month A B S&P 1 2 3 4 5 6 7 8 9 10 11 12 12.05 15.27 -4.12 1.57 3.16 -2.79 -8.97 -1.18 1.07 12.75 7.48 -0.94 25.20 2.86 5.45 4.56 3.72 10.79 5.38 -2.97 1.52 10.75 3.79 1.32 31.67 15.82 10.58 - 14.43 31.98 -0.72 - 19.64 - 10.00 -11.51 5.63 -4.67 7.94 12.28 5.99 2.41 4.48 4.41 4.43 -6.77 -2.11 3.46 6.16 2.47 -1.15 A. Compute the mean return and variance of return for each stock in Problem 1 using (1) The single-index model (2) The historical data B. Compute the covariance between each possible pair of stocks using (1) The single-index model (2) The historical data C. Compute the return and standard deviation of a portfolio constructed by placing one-third of your funds in each stock, using (1) The single-index model (2) The historical data D. Explain why the answers to parts A.1 and A.2 were the same, while the answers to parts B.1, B.2, and C.1, C.2 were different