Answered step by step
Verified Expert Solution
Question
1 Approved Answer
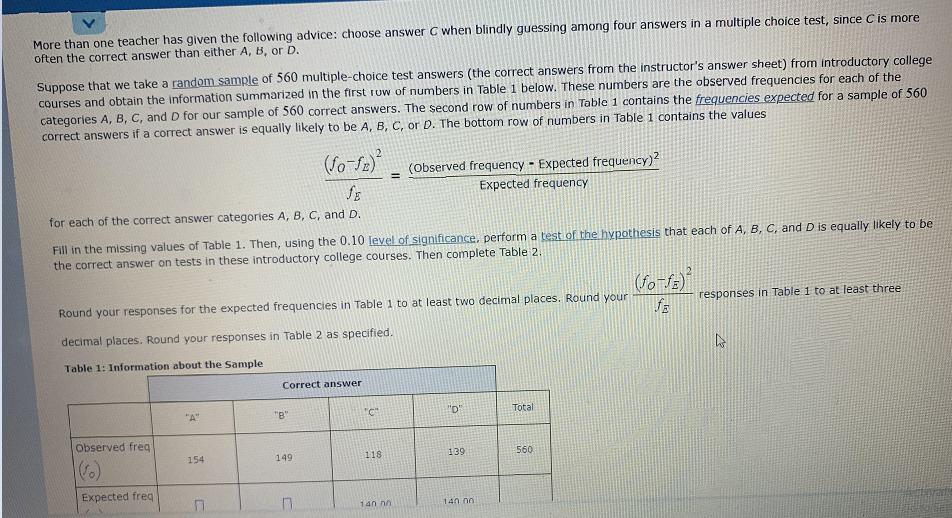
More than one teacher has given the following advice: choose answer C when blindly guessing among four answers in a multiple choice test, since


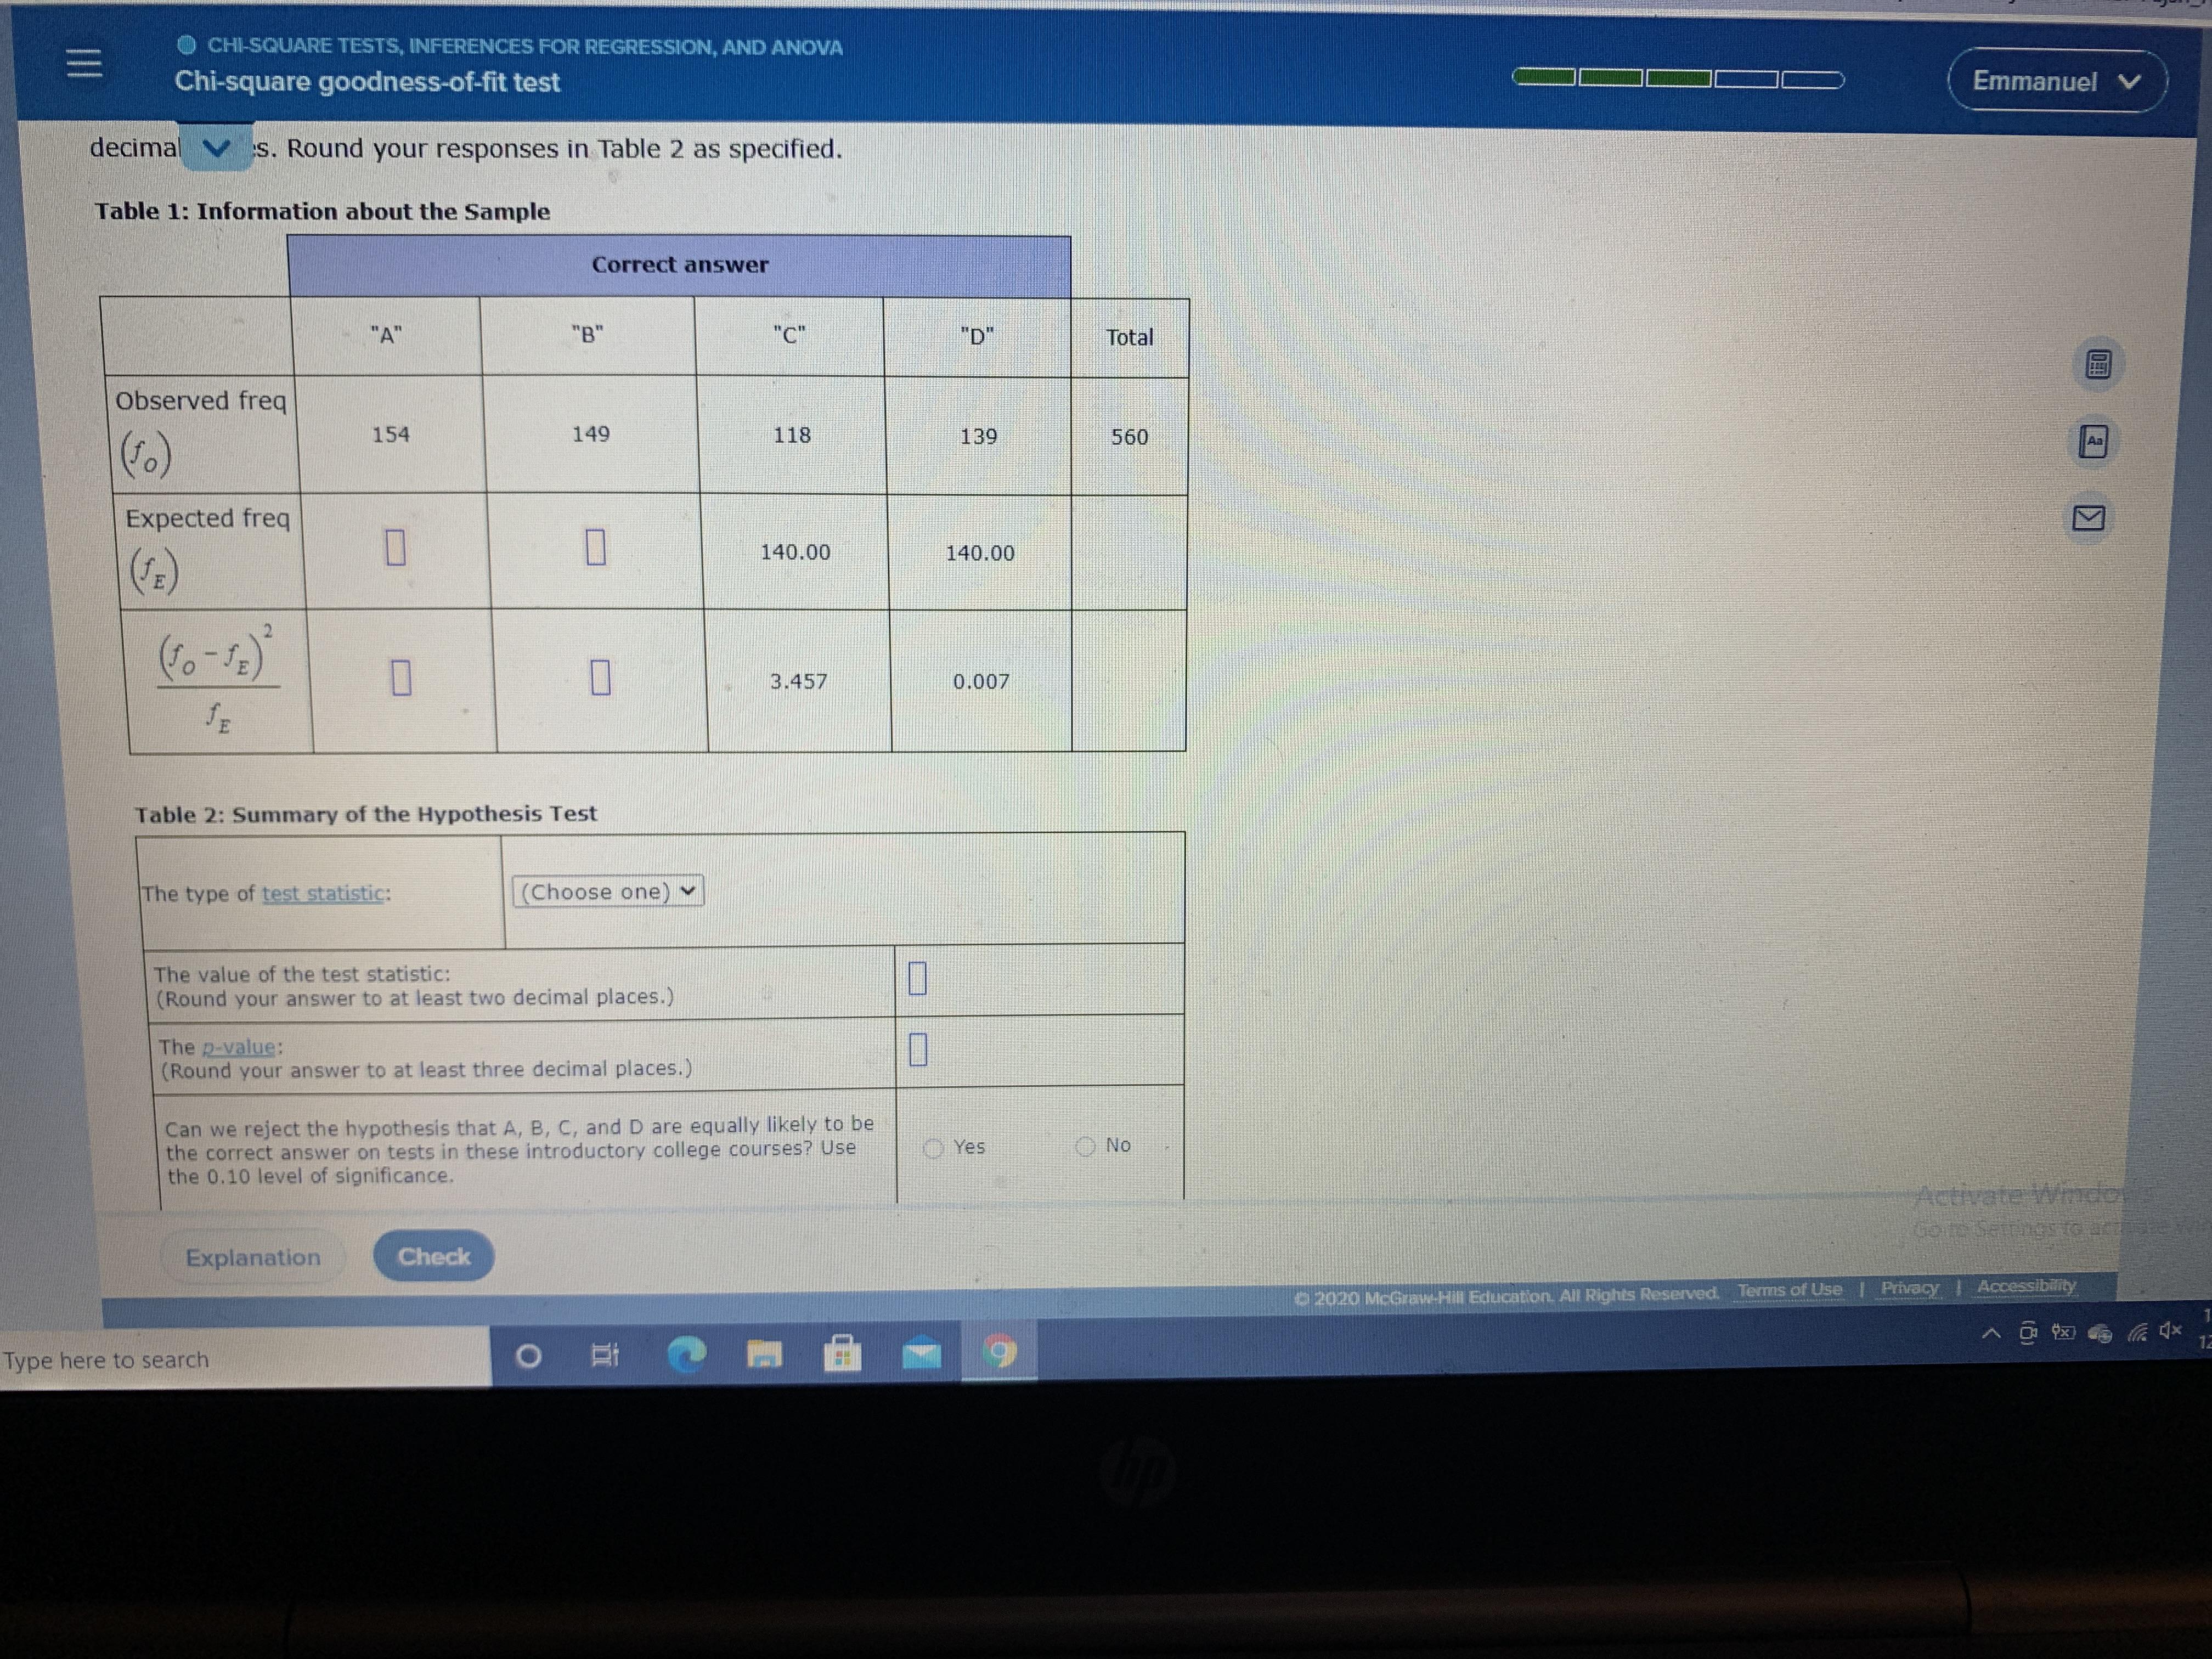
More than one teacher has given the following advice: choose answer C when blindly guessing among four answers in a multiple choice test, since C is more often the correct answer than either A, B, or D. Suppose that we take a random sample of 560 multiple-choice test answers (the correct answers from the instructor's answer sheet) from introductory college courses and obtain the information summarized in the first ruw of numbers in Table 1 below. These numbers are the observed frequencies for each of the categories A, B, C, and D for our sample of 560 correct answers. The second row of numbers in Table 1 contains the frequencies expected for a sample of 560 correct answers if a correct answer is equally likely to be A, B, C, or D. The bottom row of numbers in Table 1 contains the values (Observed frequency - Expected frequency)? Expected frequency !! for each of the correct answer categories A, B, C, and D. Fill in the missing values of Table 1. Then, using the 0.10 level of significance, perform a test lof the hypothesis that each of A, B, C, and D is equally likely to be the correct answer on tests in these introductory college courses. Then complete Table 2. Round your responses for the expected frequencies in Table 1 to at least two decimal places. Round your responses in Table 1 to at least three decimal places. Round your responses in Table 2 as specified. Table 1: Information about the Sample Correct answer "A" "B" "C* "D" Total Observed freq 154 149 118 139 560 Expected freq 140 D0 140.00 O CHI-SQUARE TESTS, INFERENCES FOR REGRESSION, AND ANOVA Chi-square goodness-of-fit test Emmanuel decimal V s. Round your responses in Table 2 as specified. Table 1: Information about the Sample Correct answer "A" "B" "C" "D" Total Observed freq 154 149 118 139 560 Aa Expected freq 140.00 140.00 3.457 0.007 E Table 2: Summary of the Hypothesis Test The type of test statistic: (Choose one) The value of the test statistic: (Round your answer to at least two decimal places.) The p-value: (Round your answer to at least three decimal places.) Can we reject the hypothesis that A, B, C, and D are equally likely to be the correct answer on tests in these introductory college courses? Use the 0.10 level of significance. O Yes O No Gore Settinos fo actade Explanation Check Accessibility 2020 McGraw-Hill Education. All Rights Reserved. Terms of Use | Privacy 12 Type here to search
Step by Step Solution
★★★★★
3.50 Rating (157 Votes )
There are 3 Steps involved in it
Step: 1

Get Instant Access to Expert-Tailored Solutions
See step-by-step solutions with expert insights and AI powered tools for academic success
Step: 2

Step: 3

Ace Your Homework with AI
Get the answers you need in no time with our AI-driven, step-by-step assistance
Get Started


