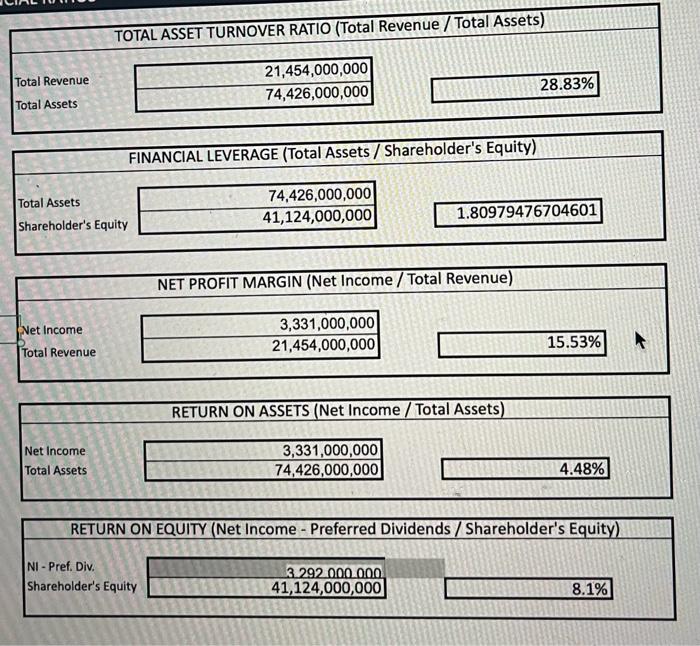
most recent fiscal qt:
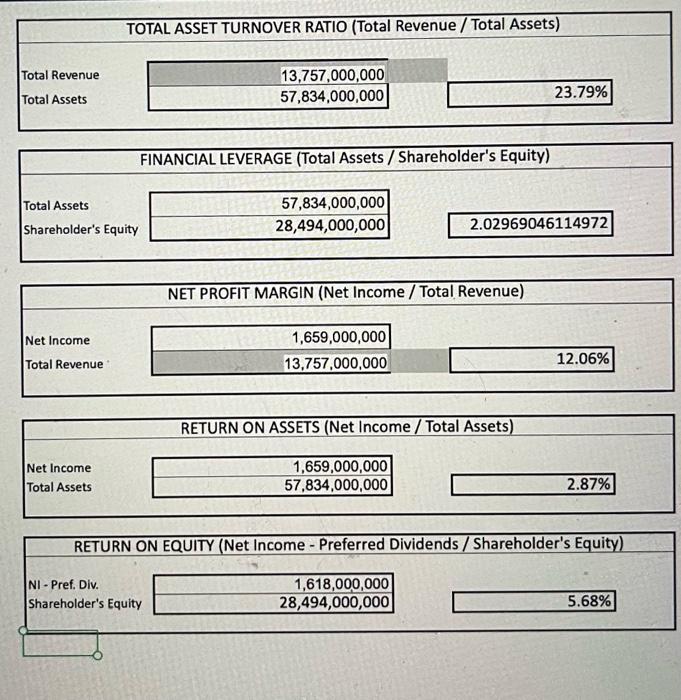
same fiscal qt last year:
please compare what the ratio reveals about the financial health and compare it to last years. explain the difference please
THANK YOU. i upvote
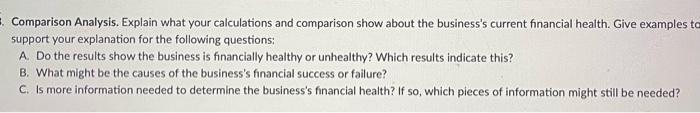
Comparison Analysis. Explain what your calculations and comparison show about the business's current financial health. Give examples to support your explanation for the following questions: A. Do the results show the business is financially healthy or unhealthy? Which results indicate this? B. What might be the causes of the business's financial success or failure? C. Is more information needed to determine the business's financial health? If so, which pieces of information might still be needed? TOTAL ASSET TURNOVER RATIO (Total Revenue/Total Assets) Total Revenue Total Assets \begin{tabular}{|r|} \hline 21,454,000,000 \\ \hline 74,426,000,000 \\ \hline \end{tabular} 28.83% FINANCIAL LEVERAGE (Total Assets / Shareholder's Equity) \begin{tabular}{l|r|} \hline Total Assets & 74,426,000,000 \\ \hline Shareholder's Equity & 41,124,000,000 \\ \hline \end{tabular} 1.80979476704601 NET PROFIT MARGIN (Net Income / Total Revenue) Net income Total Revenue \begin{tabular}{|r|} \hline 3,331,000,000 \\ \hline 21,454,000,000 \\ \hline \end{tabular} 15.53% RETURN ON ASSETS (Net Income / Total Assets) Net income Total Assets \begin{tabular}{|r|} \hline 3,331,000,000 \\ \hline 74,426,000,000 \\ \hline \end{tabular} 4.48% RETURN ON EQUITY (Net Income - Preferred Dividends / Shareholder's Equity) Ni-Pref. Div. Shareholder's Equity \begin{tabular}{|r|} \hline 3292000000 \\ 41,124,000,000 \\ \hline \end{tabular} 8.1% TOTAL ASSET TURNOVER RATIO (Total Revenue / Total Assets) Total Revenue Total Assets \begin{tabular}{|r|} \hline 13,757,000,000 \\ \hline 57,834,000,000 \\ \hline \end{tabular} 23.79% FINANCIAL LEVERAGE (Total Assets / Shareholder's Equity) Total Assets Shareholder's Equity \begin{tabular}{|r|} \hline 57,834,000,000 \\ \hline 28,494,000,000 \\ \hline \end{tabular} 2.02969046114972 NET PROFIT MARGIN (Net Income / Total Revenue) Net income Total Revenue \begin{tabular}{|r|} \hline 1,659,000,000 \\ \hline 13,757,000,000 \\ \hline \end{tabular} 12.06% RETURN ON ASSETS (Net Income / Total Assets) Net Income Total Assets \begin{tabular}{|r|} \hline 1,659,000,000 \\ \hline 57,834,000,000 \\ \hline \end{tabular} 2.87% RETURN ON EQUITY (Net Income - Preferred Dividends / Shareholder's Equity) NI-Pref. Div. Shareholder's Equity \begin{tabular}{|r|} \hline 1,618,000,000 \\ \hline 28,494,000,000 \\ \hline \end{tabular} 5.68%