

Answered step by step
Verified Expert Solution
Question
1 Approved Answer
Motivation The Mandelbrot set is a set of complex numbers. When a certain recurrence relation is applied to the numbers outside the set, quickly approach
Motivation
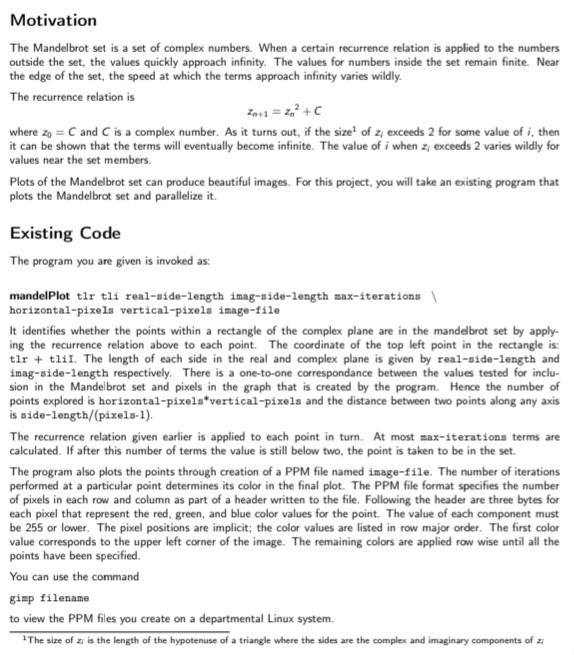
The Mandelbrot set is a set of complex numbers. When a certain recurrence relation is applied to the numbers
outside the set, quickly approach infinity. The values for numbers inside the set remain finite. Near
the edge of the set, the speed at which the terms approach infinity varies wildly.
The recurrence relation is
where and is a complex number. As it turns out, if the size of exceeds for some value of then
it can be shown that the terms will eventually become infinite. The value of i when exceeds varies wildly for
values near the set members.
Plots of the Mandelbrot set can produce beautiful images. For this project, you will take an existing program that
plots the Mandelbrot set and parallelize it
Existing Code
The program you are given is invoked as:
mandelPlot tlr tli realsidelength imagsidelength maxiterations
horizontalpixels verticalpixels imagefile
It identifies whether the points within a rectangle of the complex plane are in the mandelbrot set by apply
ing the recurrence relation above to each point. The coordinate of the top left point in the rectangle is:
tlr tiiI. The length of each side in the real and complex plane is given by realsidelength and
imagaidelength respectively. There is a onetoone correspondance between the values tested for inclu
sion in the Mandelbrot set and pixels in the graph that is created by the program. Hence the number of
points explored is horizontalpixelsverticalpixels and the distance between two points along any axis
is sidelengthpixels
The recurrence relation given earlier is applied to each point in turn. At most maxiterations terms are
calculated. If after this number of terms the value is still below two, the point is taken to be in the set.
The program also plots the points through creation of a PPM file named imagefile. The number of iterations
performed at a particular point determines its color in the final plot. The PPM file format specifies the number
of pixels in each row and column as part of a header written to the file. Following the header are three bytes for
each pixel that represent the red, green, and blue color values for the point. The value of each component must
be or lower. The pixel positions are implicit; the color values are listed in row major order. The first color
value corresponds to the upper left corner of the image. The remaining colors are applied row wise until all the
points have been specified.
You can use the command
gip filename
to view the PPM files you create on a departmental Linux system.
The size of is the length of the hypotenuse of a triangle where the sides are the complex and imaginar
Step by Step Solution
There are 3 Steps involved in it
Step: 1

Get Instant Access to Expert-Tailored Solutions
See step-by-step solutions with expert insights and AI powered tools for academic success
Step: 2

Step: 3
Ace Your Homework with AI
Get the answers you need in no time with our AI-driven, step-by-step assistance
Get Started
Database And Expert Systems Applications 31st International Conference Dexa 2020 Bratislava Slovakia September 14 17 2020 Proceedings Part 1 Lncs 12391
Authors: Sven Hartmann ,Josef Kung ,Gabriele Kotsis ,A Min Tjoa ,Ismail Khalil
1st Edition
303059002X, 978-3030590024