Mr. Adkins teaches a Current Events course and is known for making his final exam very thorough. He thinks that with the technology present


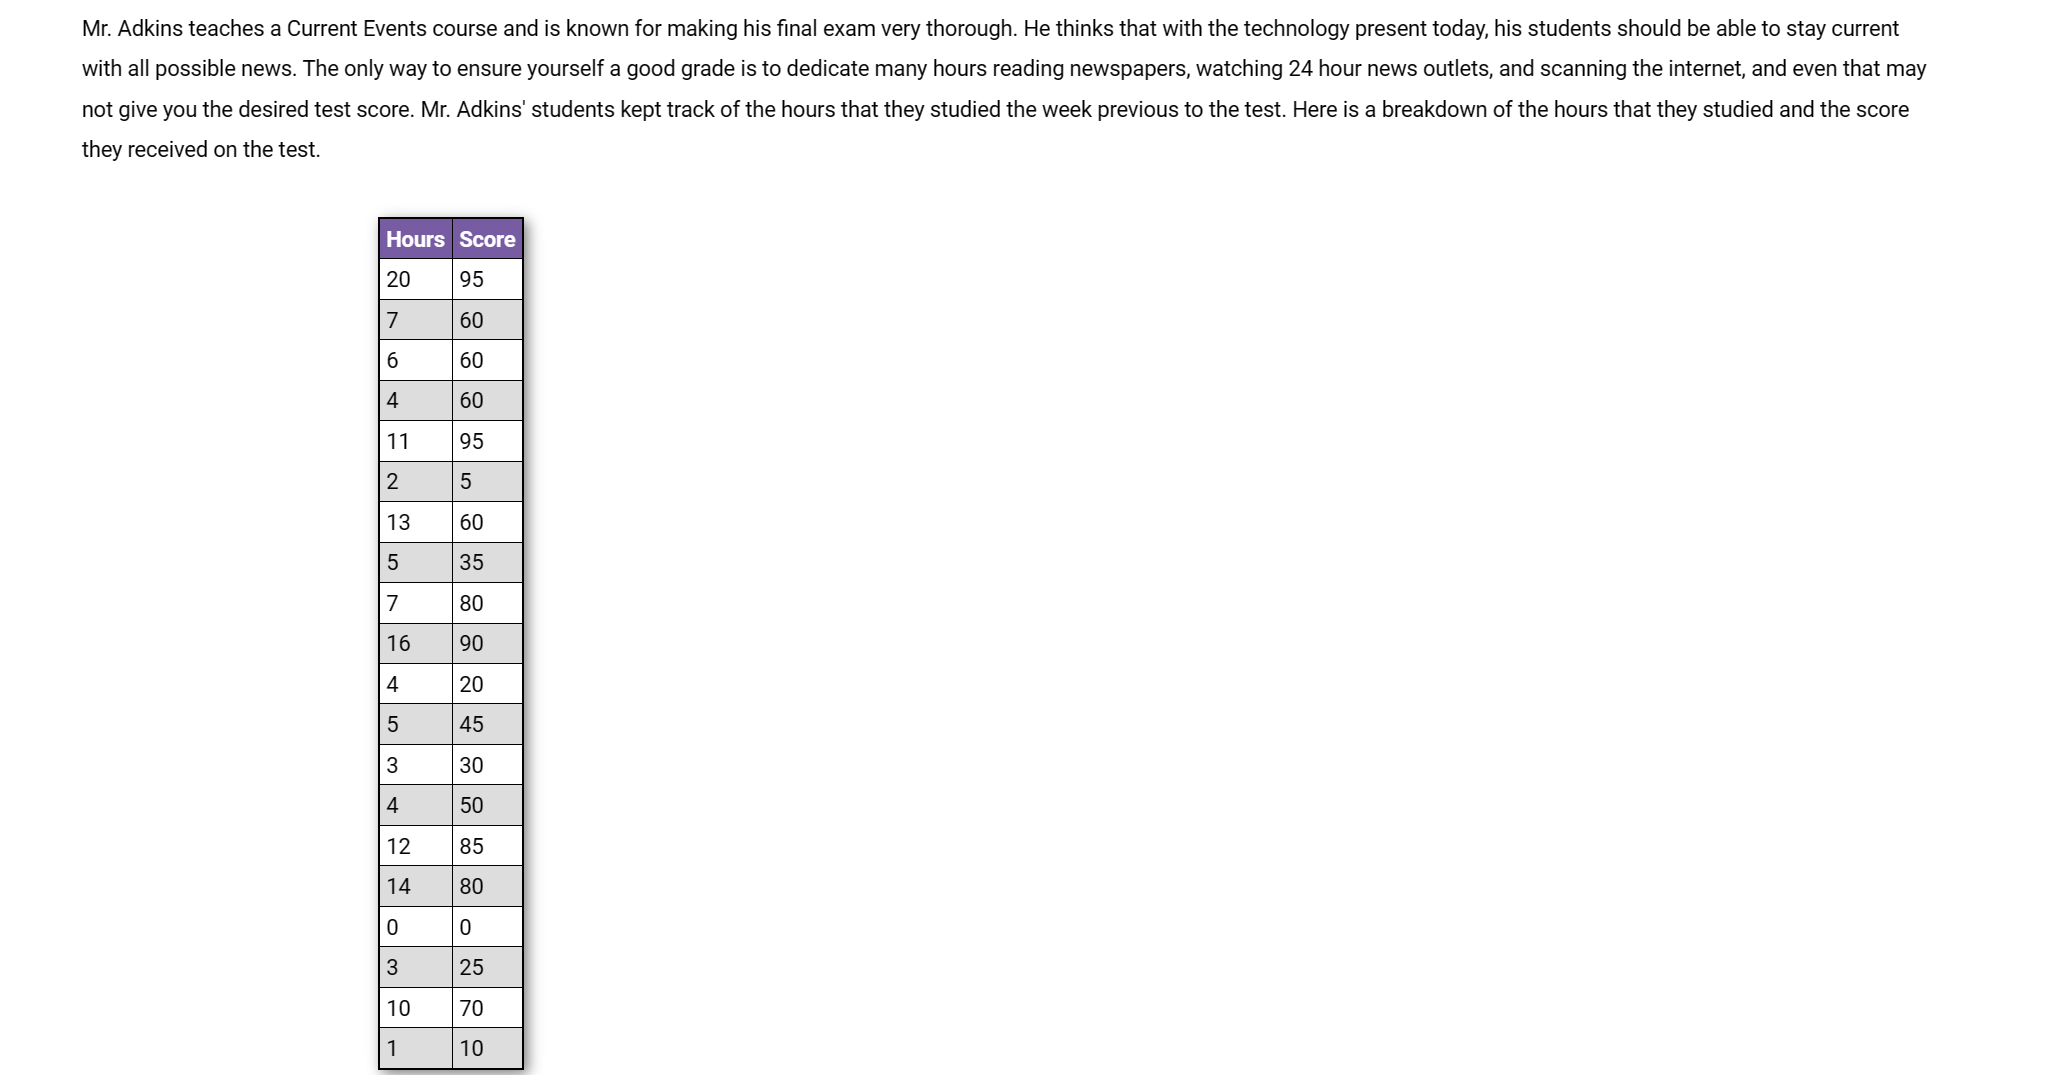
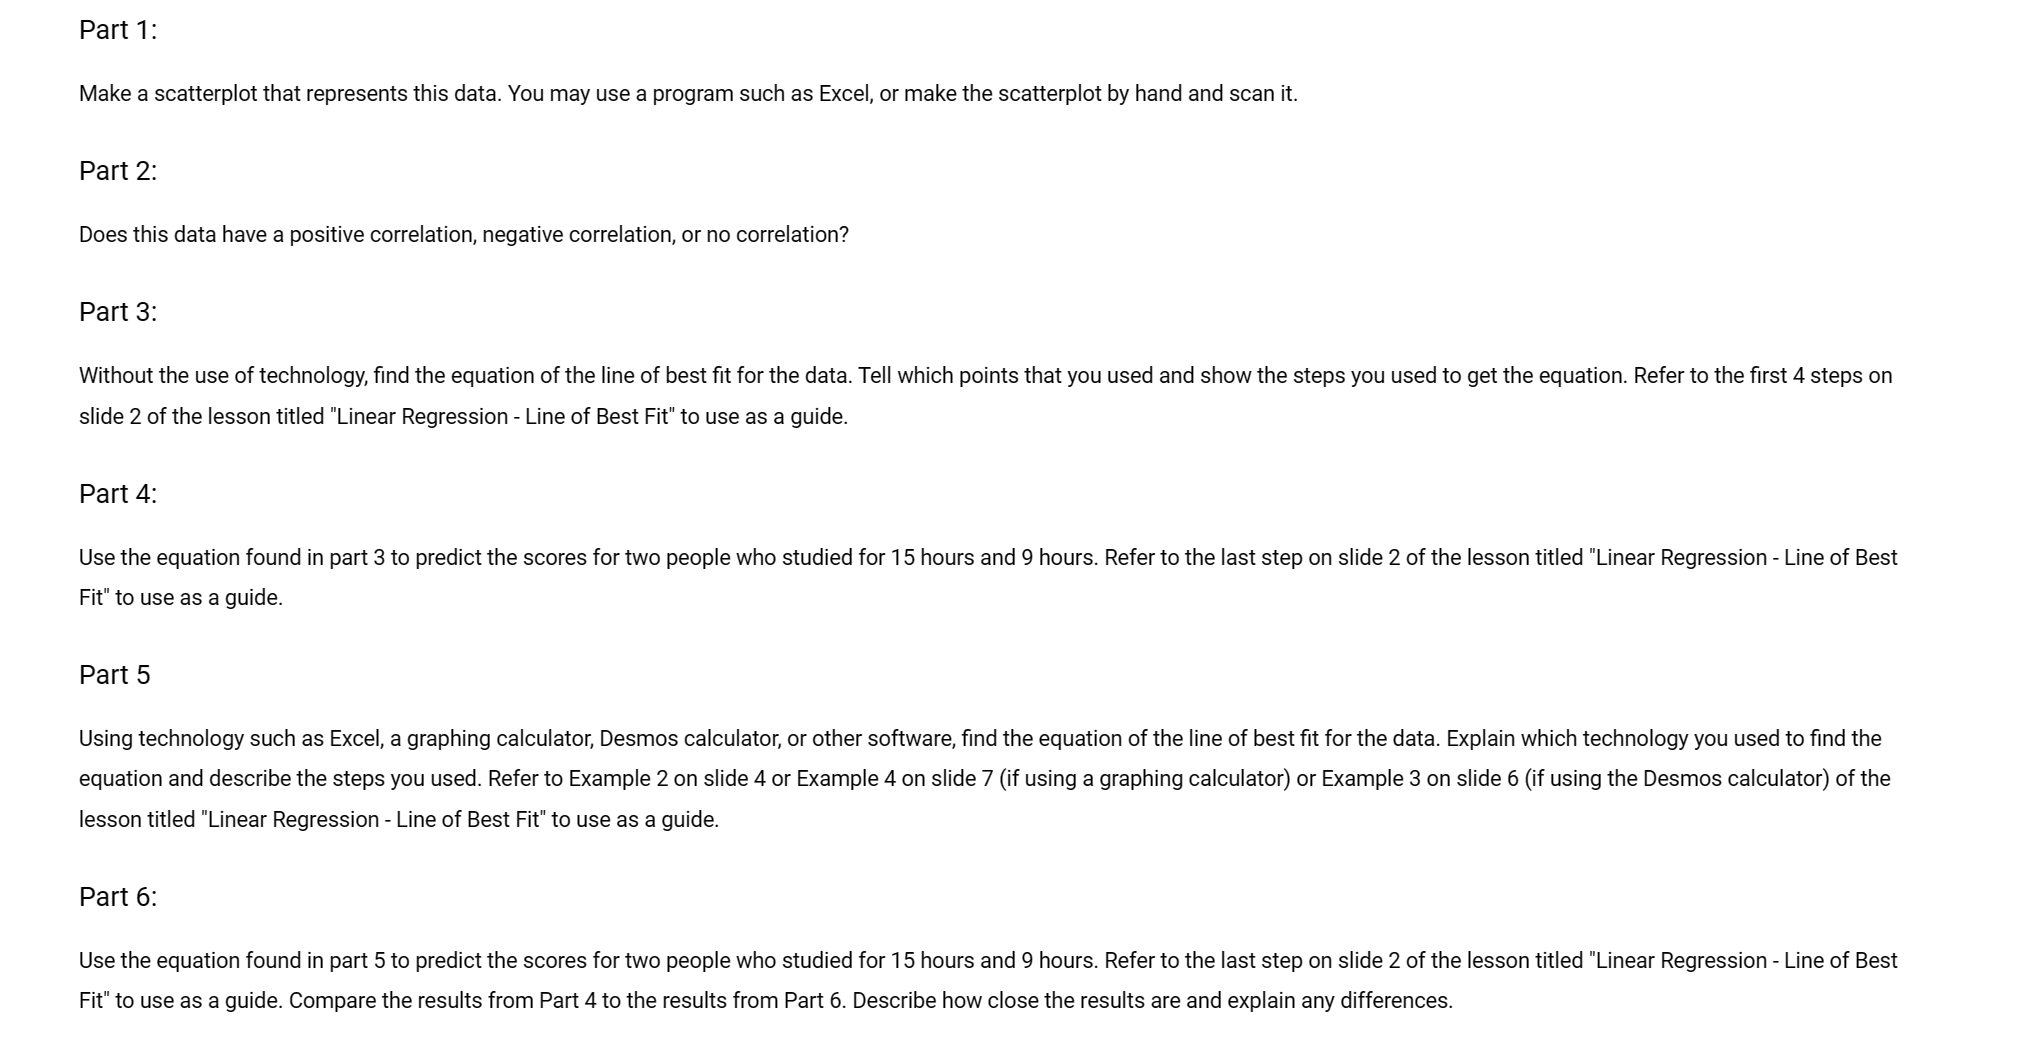
Mr. Adkins teaches a Current Events course and is known for making his final exam very thorough. He thinks that with the technology present today, his students should be able to stay current with all possible news. The only way to ensure yourself a good grade is to dedicate many hours reading newspapers, watching 24 hour news outlets, and scanning the internet, and even that may not give you the desired test score. Mr. Adkins' students kept track of the hours that they studied the week previous to the test. Here is a breakdown of the hours that they studied and the score they received on the test. Hours Score 276 20 95 60 60 4 60 11 95 27577 5 13 60 35 80 16 90 4534 20 45 30 50 12 85 14 80 03 0 25 10 70 1 10 Part 1: Make a scatterplot that represents this data. You may use a program such as Excel, or make the scatterplot by hand and scan it. Part 2: Does this data have a positive correlation, negative correlation, or no correlation? Part 3: Without the use of technology, find the equation of the line of best fit for the data. Tell which points that you used and show the steps you used to get the equation. Refer to the first 4 steps on slide 2 of the lesson titled "Linear Regression - Line of Best Fit" to use as a guide. Part 4: Use the equation found in part 3 to predict the scores for two people who studied for 15 hours and 9 hours. Refer to the last step on slide 2 of the lesson titled "Linear Regression - Line of Best Fit" to use as a guide. Part 5 Using technology such as Excel, a graphing calculator, Desmos calculator, or other software, find the equation of the line of best fit for the data. Explain which technology you used to find the equation and describe the steps you used. Refer to Example 2 on slide 4 or Example 4 on slide 7 (if using a graphing calculator) or Example 3 on slide 6 (if using the Desmos calculator) of the lesson titled "Linear Regression - Line of Best Fit" to use as a guide. Part 6: Use the equation found in part 5 to predict the scores for two people who studied for 15 hours and 9 hours. Refer to the last step on slide 2 of the lesson titled "Linear Regression - Line of Best Fit" to use as a guide. Compare the results from Part 4 to the results from Part 6. Describe how close the results are and explain any differences.
Step by Step Solution
There are 3 Steps involved in it
Step: 1
Part 1 Scatter Plot The scatter plot above displays the relationship between the study hours and test scores for Mr Adkins students Part 2 Correlation ...
See step-by-step solutions with expert insights and AI powered tools for academic success
Step: 2

Step: 3

Ace Your Homework with AI
Get the answers you need in no time with our AI-driven, step-by-step assistance
Get Started


