Question
Mr. Fleming was concerned about BFIs profitability. Last year, BFI negotiated with 101App to charge a fixed premium of $250 per employee per month. The
Mr. Fleming was concerned about BFIs profitability. Last year, BFI negotiated with 101App to charge a fixed premium of $250 per employee per month.
The total premium revenue is allocated as follows: 55% to hospital and surgical services, 30% to physician visits, and 15% for other services, administration, and profit. These allocations are used to establish budgets in the different departments at BFI.
The 101App contract would expire next month, at which time BFI would need to renegotiate the terms of its contract with 101App. Mr. Fleming feared that BFI would have to request a sharp rate increase to remain profitable. BFIs monthly cost of administering the health plan was fixed, but the increases in the use of health care services were eroding BFIs profits. He suspected that other health plans were planning to increase premiums by 5-10 percent, which was reasonable given the recent statistics on national health expenditures. A report from 2004, the most recent he could find, indicated that total national health expenditures rose 7.9 percent from 2003 to 2004 -- over three times the rate of inflation.

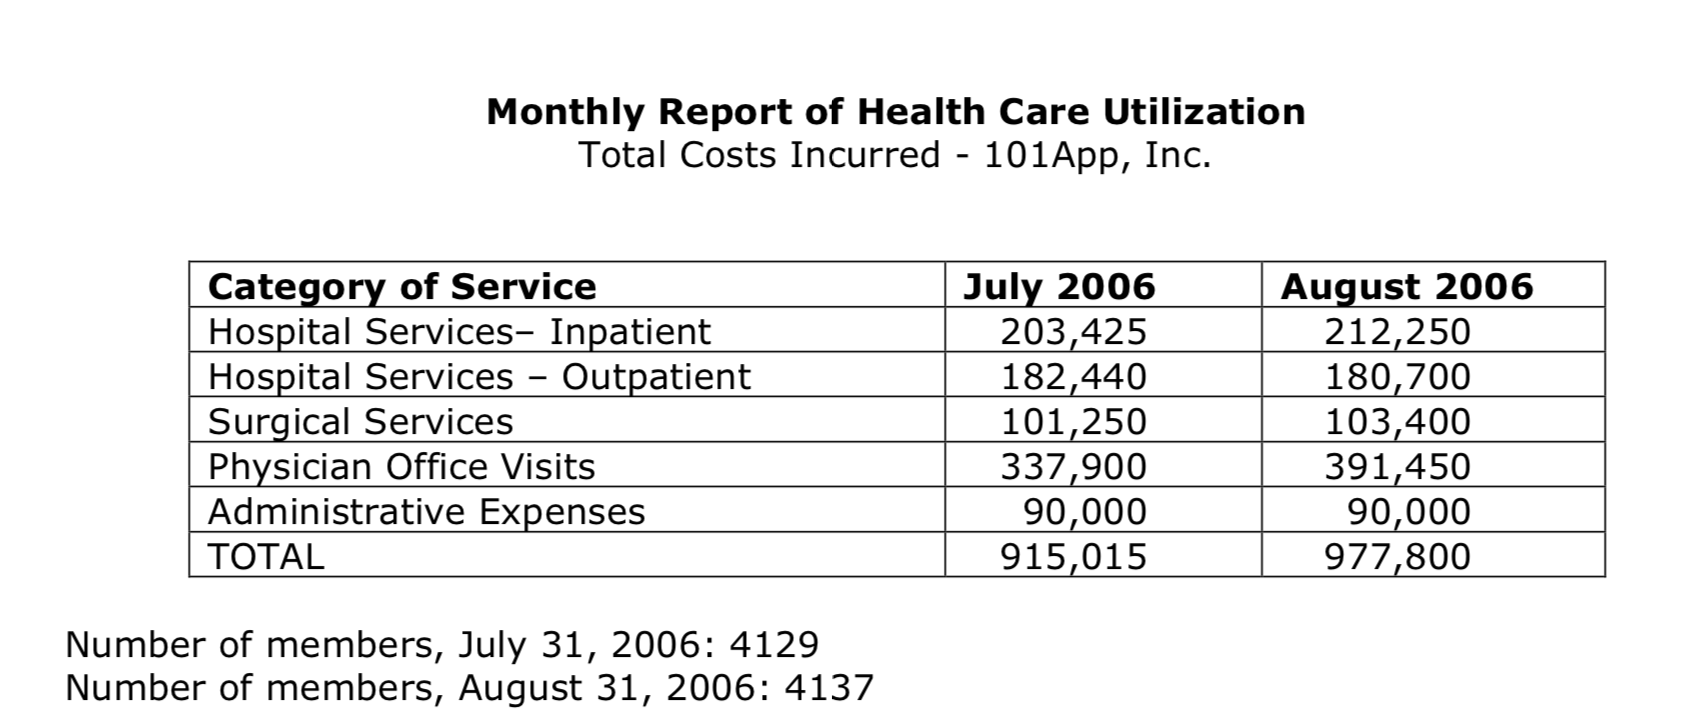
Q. 1. Using only the information provided in Exhibit 1, explain why further analysis of physician visits may be needed. Compare the profitability of hospital and surgical services to physician services, using the allocation of revenue that was given. Show the breakdown of the $250 premium using a bar chart. Does the allocation of the $250 per employee per month payment across the types of health care services seem reasonable, given the past two months utilization?
Please add some explanation and steps to the answer when you calculate everything. Thanks
Monthly Report of Health Care Utilization Total Costs Incurred - 101App, Inc. Category of Service Hospital Services, Inpatient Hospital Services Outpatient Surgical Services Physician Office Visits Administrative Expenses TOTAL July 2006 203,425 182,440 101,250 337,900 90,000 915,015 August 2006 212,250 180,700 103,400 391,450 90,000 977,800 Number of members, July 31, 2006: 4129 Number of members, August 31, 2006: 4137Step by Step Solution
There are 3 Steps involved in it
Step: 1

Get Instant Access to Expert-Tailored Solutions
See step-by-step solutions with expert insights and AI powered tools for academic success
Step: 2

Step: 3

Ace Your Homework with AI
Get the answers you need in no time with our AI-driven, step-by-step assistance
Get Started


