Question
Mr. Lucas referred to a national study of copayment levels. The important results of this study are provided in Exhibit 3. Using the six months
Mr. Lucas referred to a national study of copayment levels. The important results of this study are provided in Exhibit 3.

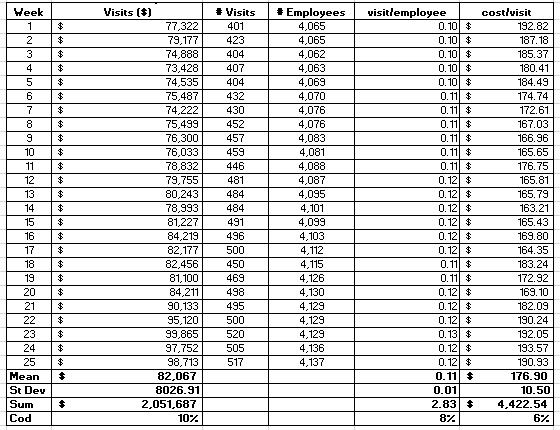
Using the six months of data provided in the Excel data file, simulate the profitability of the physician services department if copayments are increased to $20 per visit. Repeat your analysis using a copayment of $25 per visit. (from $15 per visit)

Copayment level Physician visits per capita Price elasticity of demand 10 6.3 15 6 0.095 20 5.7 0.150 25 5.4 0.211 30 5.1 0.278 35 4.8 0.353
Step by Step Solution
3.49 Rating (152 Votes )
There are 3 Steps involved in it
Step: 1

Get Instant Access to Expert-Tailored Solutions
See step-by-step solutions with expert insights and AI powered tools for academic success
Step: 2

Step: 3

Ace Your Homework with AI
Get the answers you need in no time with our AI-driven, step-by-step assistance
Get StartedRecommended Textbook for
Statistics For Business And Economics
Authors: Paul Newbold, William Carlson, Betty Thorne
8th Edition
0132745658, 978-0132745659
Students also viewed these Accounting questions
Question
Answered: 1 week ago
Question
Answered: 1 week ago
Question
Answered: 1 week ago
Question
Answered: 1 week ago
Question
Answered: 1 week ago
Question
Answered: 1 week ago
Question
Answered: 1 week ago
Question
Answered: 1 week ago
Question
Answered: 1 week ago
Question
Answered: 1 week ago
Question
Answered: 1 week ago
Question
Answered: 1 week ago
Question
Answered: 1 week ago
Question
Answered: 1 week ago
Question
Answered: 1 week ago
Question
Answered: 1 week ago
Question
Answered: 1 week ago
Question
Answered: 1 week ago
Question
Answered: 1 week ago
Question
Answered: 1 week ago
Question
Answered: 1 week ago
Question
Answered: 1 week ago
View Answer in SolutionInn App


