Answered step by step
Verified Expert Solution
Link Copied!

Question

1 Approved Answer

Mr. Reynolds will analyze the stock data at varying levels of detail. For instance, he wants to see the return by industry, and he wants
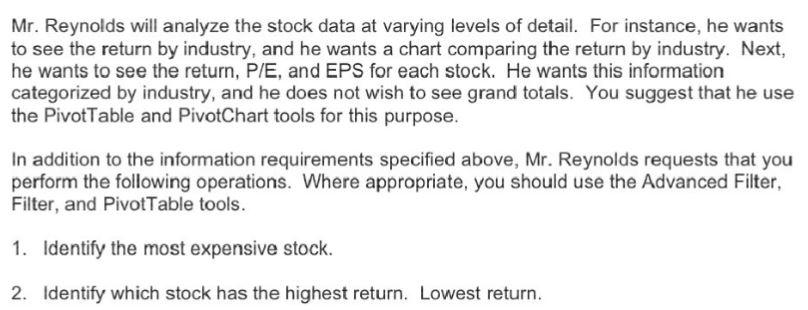
image text in transcribed

Mr. Reynolds will analyze the stock data at varying levels of detail. For instance, he wants to see the return by industry, and he wants a chart comparing the return by industry. Next, he wants to see the return, P/E, and EPS for each stock. He wants this information categorized by industry, and he does not wish to see grand totals. You suggest that he use the PivotTable and PivotChart tools for this purpose. In addition to the information requirements specified above, Mr. Reynolds requests that you perform the following operations. Where appropriate, you should use the Advanced Filter, Filter, and PivotTable tools. 1. Identify the most expensive stock. 2. Identify which stock has the highest return. Lowest return

Step by Step Solution

There are 3 Steps involved in it

Step: 1

blur-text-image

Get Instant Access to Expert-Tailored Solutions

See step-by-step solutions with expert insights and AI powered tools for academic success

Step: 2

blur-text-image

Step: 3

blur-text-image

Ace Your Homework with AI

Get the answers you need in no time with our AI-driven, step-by-step assistance

Get Started

Recommended Textbook for

Operations Management A Supply Chain Process Approach

Authors: Joel D. Wisner

1st edition

978-1506354187, 1506354181, 1483383067, 978-1483383064

More Books

Students also viewed these General Management questions