Answered step by step
Verified Expert Solution
Question
1 Approved Answer
Mr. Smith comes to you as a financial analyst to advise you regarding the financial condition of his company PRISM inc. He is considering


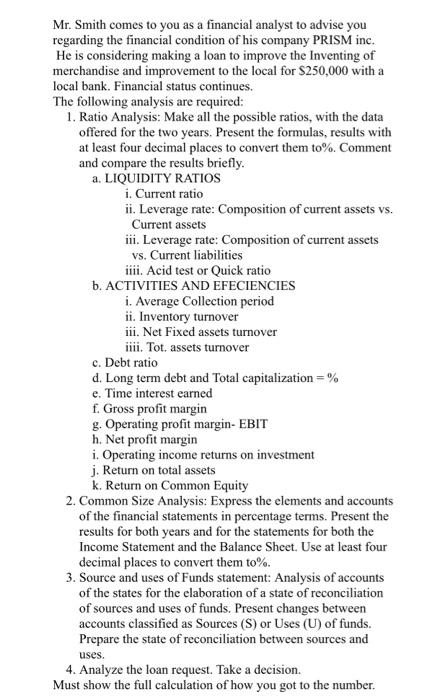
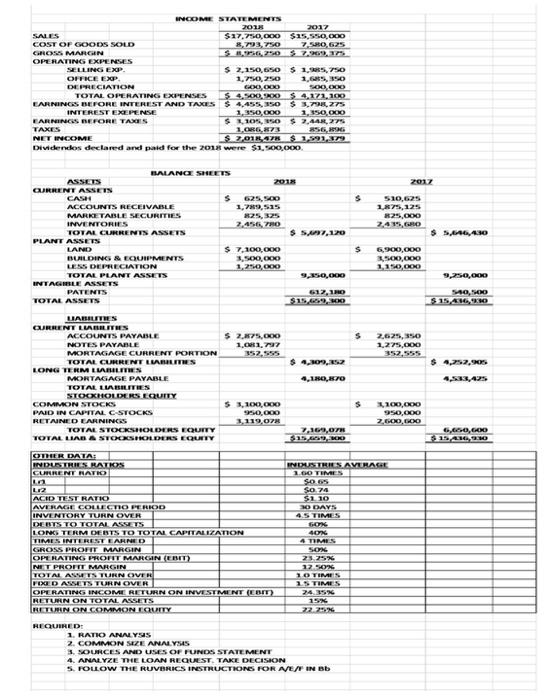
Mr. Smith comes to you as a financial analyst to advise you regarding the financial condition of his company PRISM inc. He is considering making a loan to improve the Inventing of merchandise and improvement to the local for $250,000 with a local bank. Financial status continues. The following analysis are required: 1. Ratio Analysis: Make all the possible ratios, with the data offered for the two years. Present the formulas, results with at least four decimal places to convert them to%. Comment and compare the results briefly. a. LIQUIDITY RATIOS i. Current ratio ii. Leverage rate: Composition of current assets vs. Current assets iii. Leverage rate: Composition of current assets vs. Current liabilities iiii. Acid test or Quick ratio b. ACTIVITIES AND EFECIENCIES i. Average Collection period ii. Inventory turnover iii. Net Fixed assets turnover iiii. Tot. assets turnover c. Debt ratio d. Long term debt and Total capitalization = % e. Time interest earned f. Gross profit margin g. Operating profit margin- EBIT h. Net profit margin i. Operating income returns on investment j. Return on total assets k. Return on Common Equity 2. Common Size Analysis: Express the elements and accounts of the financial statements in percentage terms. Present the results for both years and for the statements for both the Income Statement and the Balance Sheet. Use at least four decimal places to convert them to%. 3. Source and uses of Funds statement: Analysis of accounts of the states for the elaboration of a state of reconciliation of sources and uses of funds. Present changes between accounts classified as Sources (S) or Uses (U) of funds. Prepare the state of reconciliation between sources and uses. 4. Analyze the loan request. Take a decision. Must show the full calculation of how you got to the number. SALES COST OF GOODS SOLD GROSS MARGIN OPERATING EXPENSES SELLING EXP. OFFICE EXP DEPRECIATION TOTAL OPERATING EXPENSES EARNINGS BEFORE INTEREST AND TAXES INTEREST EXEPENSE EARNINGS BEFORE TAXES TAXES NET INCOME ASSETS CURRENT ASSETS Dividendos declared and paid for the 2018 were $1,500,000. CASH ACCOUNTS RECEIVABLE MARKETABLE SECURITIES INVENTORIES PLANT ASSETS LAND TOTAL CURRENTS ASSETS INTAGIBLE ASSETS BUILDING & EQUIPMENTS LESS DEPRECIATION TOTAL PLANT ASSETS PATENTS TOTAL ASSETS LIABILITIES CURRENT LIABILITIES ACCOUNTS PAYABLE NOTES PAYABLE MORTAGAGE CURRENT PORTION LONG TERM LIABILITIES TOTAL CURRENT LIABILITIES INCOME STATEMENTS 2018 MORTAGAGE PAYABLE TOTAL LIABILITIES BALANCE SHEETS STOCKHOLDERS EQUITY COMMON STOCKS PAID IN CAPITAL C-STOCKS RETAINED EARNINGS OTHER DATA: INDUSTRIES RATIOS CURRENT RATIO TOTAL STOCKSHOLDERS EQUITY TOTAL LIAB & STOOKSHOLDERS EQUITY La LIZ ACID TEST RATIO AVERAGE COLLECTIO PERIOD INVENTORY TURN OVER 2017 $17,750,000 $15,550,000 8,793,750 7,580,675 $8,956,250 $7,969,375 OPERATING PROFIT MARGIN (EBIT) NET PROFIT MARGIN REQUIRED: $ 2,150,650 $ 1,985,750 1,750,250 1,685, 350 600,000 $4,500,900 $4,455, 350 1,350,000 $1,105, 350 1,086,873 856,896 $7,018,478 $ 1,591,379 1. RATIO ANALYSIS SIZE $ 625,500 1,789,515 825,325 2,456,780 DEBTS TO TOTAL ASSETS LONG TERM DEBTS TO TOTAL CAPITALIZATION TIMES INTEREST EARNED GROSS PROFIT MARGIN 2018 $ 7,100,000 3,500,000 1,250,000 $ 2,875,000 1,081,797 352,555 $ 3,100,000 950,000 3,119,078 TOTAL ASSETS TURN OVER FIXED ASSETS TURN OVER OPERATING INCOME RETURN ON INVESTMENT (EBIT) RETURN ON TOTAL ASSETS RETURN ON COMMON EQUITY 500,000 $ 4,171,100 $3,798,275 1,350,000 $2,448,275 $ 5,097,120 9,350,000 617,180 $15,659,300 4,180,870 7,169,078 $15,659,300 1.00 TIMES 50 65 $0.74 $1.30 30 DAYS 4.5 TIMES 60% 40% 4 TIMES 50% 23.25% 12.50% 10 TIMES 15 TIMES 24.35% 15% 22.25% S 545 3. SOURCES AND USES OF FUNDS STATEMENT 4. ANALYZE THE LOAN REQUEST. TAKE DECISION 5. FOLLOW THE RUVBRICS INSTRUCTIONS FOR A/E/F IN Bb $ INDUSTRIES AVERAGE 2017 510,625 1,875,125 825,000 2,435,680 6,900,000 3,500,000 1,150,000 2,625,350 1,275,000 352,555 1,100,000 950,000 2,600,000 $ 5,646,430 9,250,000 540,500 $15,436,9:30 $4,252,905 4,533,425 6,650,600 $15,436,930
Step by Step Solution
★★★★★
3.53 Rating (150 Votes )
There are 3 Steps involved in it
Step: 1

Get Instant Access to Expert-Tailored Solutions
See step-by-step solutions with expert insights and AI powered tools for academic success
Step: 2

Step: 3

Ace Your Homework with AI
Get the answers you need in no time with our AI-driven, step-by-step assistance
Get Started


