Multiple Choice Problem
Select the correct options, you may use a programming language such as "R" if necessary.
Please give a detailed explanation.
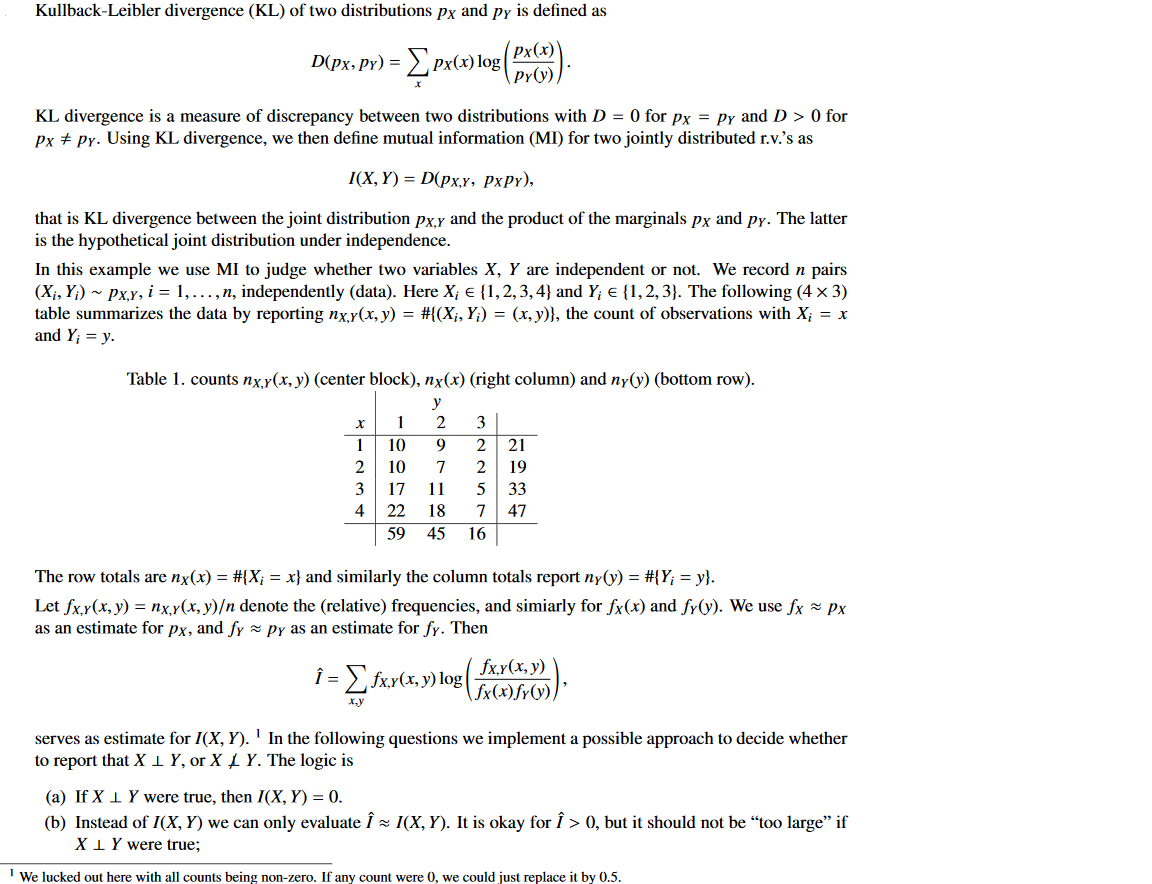
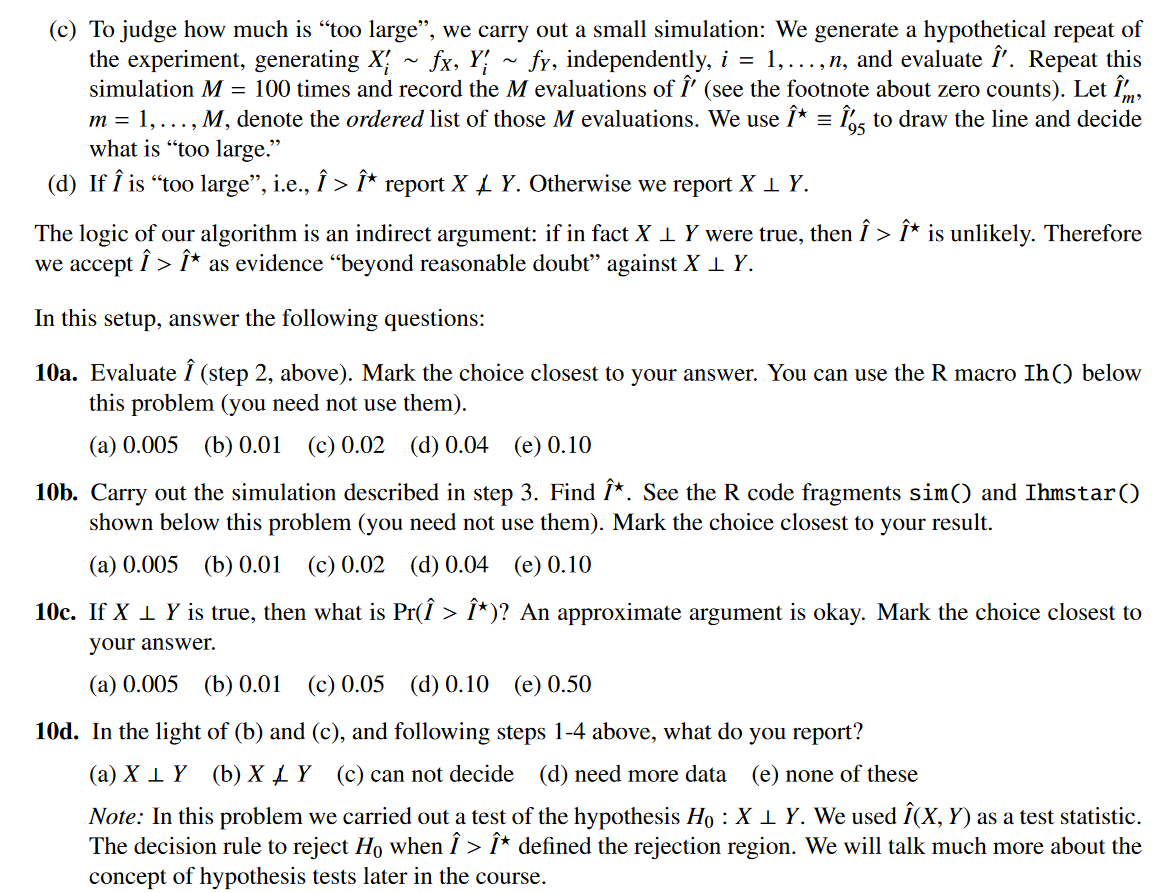
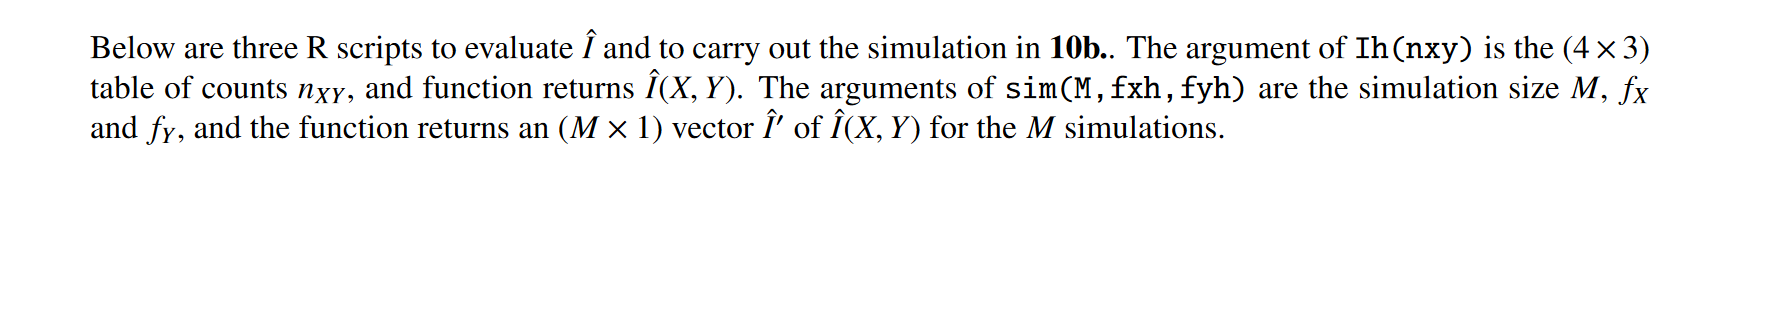
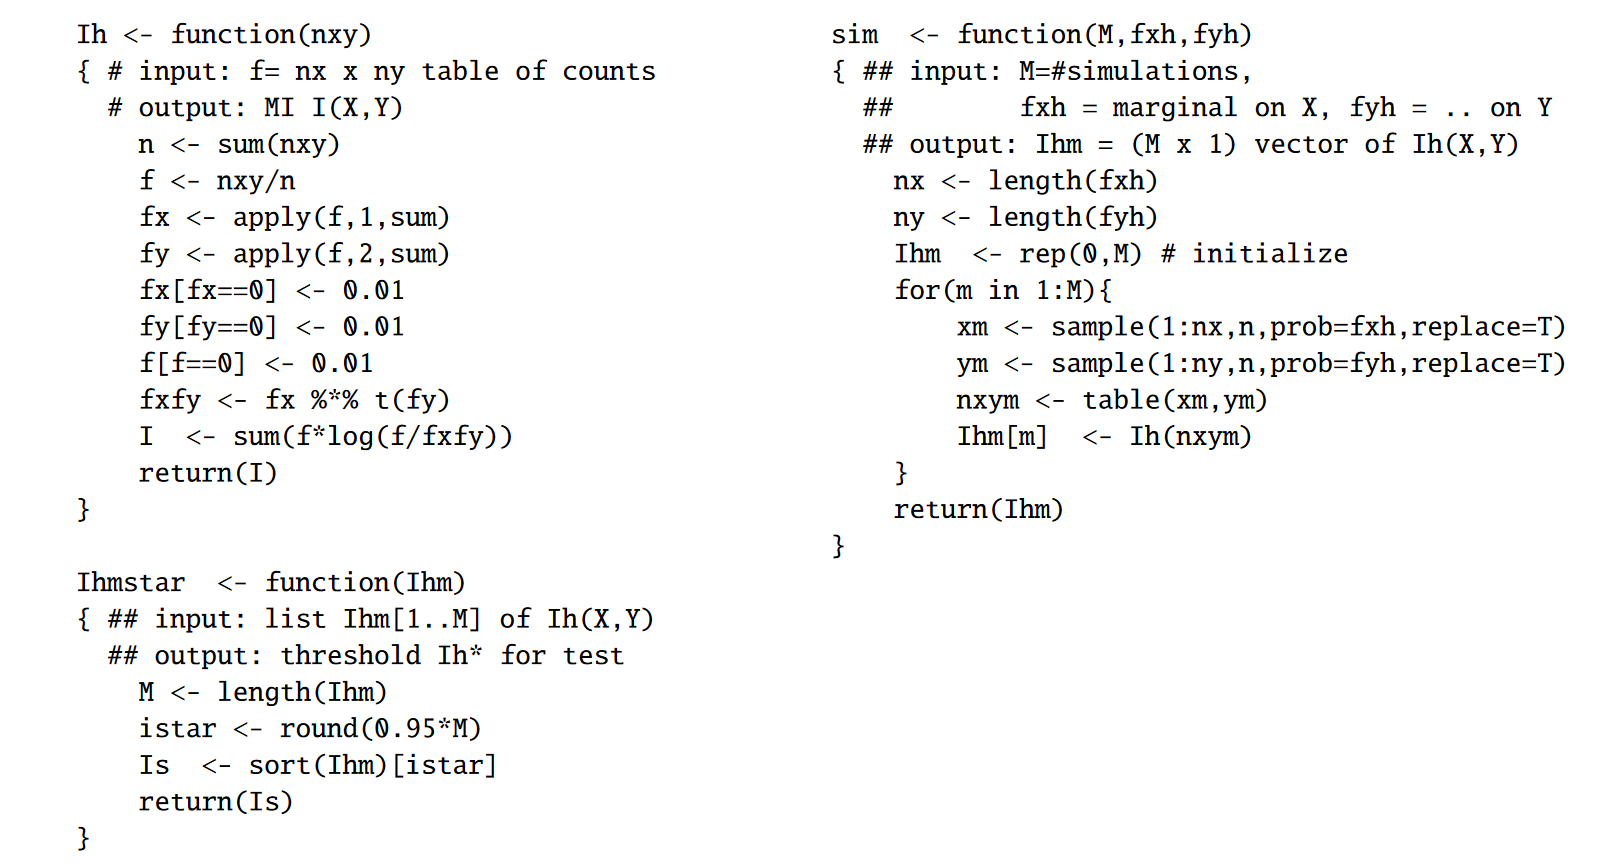
Kullback-Leibler divergence (KL) of two distributions Px and Py is defined as D(px, Py) = p(r)] (r)log (px(*) KL divergence is a measure of discrepancy between two distributions with D = 0 for Px = Py and D > 0 for Px # Pr. Using KL divergence, we then define mutual information (MI) for two jointly distributed r.v.'s as I(X,Y)= D(px,y, PxPY), that is KL divergence between the joint distribution px,y and the product of the marginals Px and py. The latter is the hypothetical joint distribution under independence. In this example we use MI to judge whether two variables X, Y are independent or not. We record n pairs (Xi, Y;) ~Px,y, i = 1,..., n, independently (data). Here X; {1,2,3,4} and Y; E{1,2,3}. The following (4 x 3) table summarizes the data by reporting nx,y(x, y) = #{(Xi, Y;) = (x, y)}, the count of observations with X; = x and Y; = y. Table 1. counts nx,y(x, y) (center block), nx(x) (right column) and nyby) (bottom row). y x 1 2 3 1 10 9 2 21 2 10 7 2 19 3 17 11 5 33 4 22 18 7 47 59 45 16 The row totals are nx(x) = #{X; = x} and similarly the column totals report nyly) = #{Y; = y}. Let fx,y(x,y) = nx,y(x,y) denote the relative) frequencies, and simiarly for fx(x) and fyly). We use fx = Px as an estimate for px, and fypy as an estimate for fy. Then i = {fxy(x, y)log(saw)5C) fxy(x, y) X serves as estimate for I(X, Y). In the following questions we implement a possible approach to decide whether to report that X 1 Y, or X | Y. The logic is (a) If XIY were true, then I(X,Y) = 0. (b) Instead of I(X,Y) we can only evaluate I(X,Y). It is okay for > 0, but it should not be "too large if XIY were true; We lucked out here with all counts being non-zero. If any count were 0, we could just replace it by 0.5. (c) To judge how much is too large, we carry out a small simulation: We generate a hypothetical repeat of the experiment, generating X; - fx, Y; ~ fy, independently, i = 1,...,n, and evaluate '. Repeat this simulation M = 100 times and record the M evaluations of ' (see the footnote about zero counts). Let m, m = 1, ..., M, denote the ordered list of those M evaluations. We use * = ns to draw the line and decide what is too large. (d) If is too large, i.e., > * report X | Y. Otherwise we report X 1 Y. The logic of our algorithm is an indirect argument: if in fact X 1 Y were true, then > * is unlikely. Therefore we accept > t as evidence beyond reasonable doubt against X 1 Y. In this setup, answer the following questions: 10a. Evaluate (step 2, above). Mark the choice closest to your answer. You can use the R macro Ih() below this problem (you need not use them). (a) 0.005 (b) 0.01 (c) 0.02 (d) 0.04 (e) 0.10 10b. Carry out the simulation described in step 3. Find *. See the R code fragments sim() and Ihmstar() shown below this problem (you need not use them). Mark the choice closest to your result. (a) 0.005 (b) 0.01 (c) 0.02 (d) 0.04 (e) 0.10 10c. If X 1 Y is true, then what is Pr( > *)? An approximate argument is okay. Mark the choice closest to your answer. (a) 0.005 (b) 0.01 (c) 0.05 (d) 0.10 (e) 0.50 10d. In the light of (b) and (c), and following steps 1-4 above, what do you report? (a) X1Y (b)X LY (c) can not decide (d) need more data (e) none of these Note: In this problem we carried out a test of the hypothesis Ho :X1 Y. We used (X, Y) as a test statistic. The decision rule to reject Ho when > * defined the rejection region. We will talk much more about the concept of hypothesis tests later in the course. Below are three R scripts to evaluate and to carry out the simulation in 10b.. The argument of Ih(nxy) is the (4 x3) table of counts nxy, and function returns (X, Y). The arguments of sim(M, fxh, fyh) are the simulation size M, fx and fy, and the function returns an (M x 1) vector ' of (X, Y) for the M simulations. Ih 0 for Px # Pr. Using KL divergence, we then define mutual information (MI) for two jointly distributed r.v.'s as I(X,Y)= D(px,y, PxPY), that is KL divergence between the joint distribution px,y and the product of the marginals Px and py. The latter is the hypothetical joint distribution under independence. In this example we use MI to judge whether two variables X, Y are independent or not. We record n pairs (Xi, Y;) ~Px,y, i = 1,..., n, independently (data). Here X; {1,2,3,4} and Y; E{1,2,3}. The following (4 x 3) table summarizes the data by reporting nx,y(x, y) = #{(Xi, Y;) = (x, y)}, the count of observations with X; = x and Y; = y. Table 1. counts nx,y(x, y) (center block), nx(x) (right column) and nyby) (bottom row). y x 1 2 3 1 10 9 2 21 2 10 7 2 19 3 17 11 5 33 4 22 18 7 47 59 45 16 The row totals are nx(x) = #{X; = x} and similarly the column totals report nyly) = #{Y; = y}. Let fx,y(x,y) = nx,y(x,y) denote the relative) frequencies, and simiarly for fx(x) and fyly). We use fx = Px as an estimate for px, and fypy as an estimate for fy. Then i = {fxy(x, y)log(saw)5C) fxy(x, y) X serves as estimate for I(X, Y). In the following questions we implement a possible approach to decide whether to report that X 1 Y, or X | Y. The logic is (a) If XIY were true, then I(X,Y) = 0. (b) Instead of I(X,Y) we can only evaluate I(X,Y). It is okay for > 0, but it should not be "too large if XIY were true; We lucked out here with all counts being non-zero. If any count were 0, we could just replace it by 0.5. (c) To judge how much is too large, we carry out a small simulation: We generate a hypothetical repeat of the experiment, generating X; - fx, Y; ~ fy, independently, i = 1,...,n, and evaluate '. Repeat this simulation M = 100 times and record the M evaluations of ' (see the footnote about zero counts). Let m, m = 1, ..., M, denote the ordered list of those M evaluations. We use * = ns to draw the line and decide what is too large. (d) If is too large, i.e., > * report X | Y. Otherwise we report X 1 Y. The logic of our algorithm is an indirect argument: if in fact X 1 Y were true, then > * is unlikely. Therefore we accept > t as evidence beyond reasonable doubt against X 1 Y. In this setup, answer the following questions: 10a. Evaluate (step 2, above). Mark the choice closest to your answer. You can use the R macro Ih() below this problem (you need not use them). (a) 0.005 (b) 0.01 (c) 0.02 (d) 0.04 (e) 0.10 10b. Carry out the simulation described in step 3. Find *. See the R code fragments sim() and Ihmstar() shown below this problem (you need not use them). Mark the choice closest to your result. (a) 0.005 (b) 0.01 (c) 0.02 (d) 0.04 (e) 0.10 10c. If X 1 Y is true, then what is Pr( > *)? An approximate argument is okay. Mark the choice closest to your answer. (a) 0.005 (b) 0.01 (c) 0.05 (d) 0.10 (e) 0.50 10d. In the light of (b) and (c), and following steps 1-4 above, what do you report? (a) X1Y (b)X LY (c) can not decide (d) need more data (e) none of these Note: In this problem we carried out a test of the hypothesis Ho :X1 Y. We used (X, Y) as a test statistic. The decision rule to reject Ho when > * defined the rejection region. We will talk much more about the concept of hypothesis tests later in the course. Below are three R scripts to evaluate and to carry out the simulation in 10b.. The argument of Ih(nxy) is the (4 x3) table of counts nxy, and function returns (X, Y). The arguments of sim(M, fxh, fyh) are the simulation size M, fx and fy, and the function returns an (M x 1) vector ' of (X, Y) for the M simulations. Ih