Answered step by step
Verified Expert Solution
Link Copied!

Question

1 Approved Answer

Multiple regression was run for a random sample of 21 redwood trees, and the following output information was generated. The dependent variable was the height
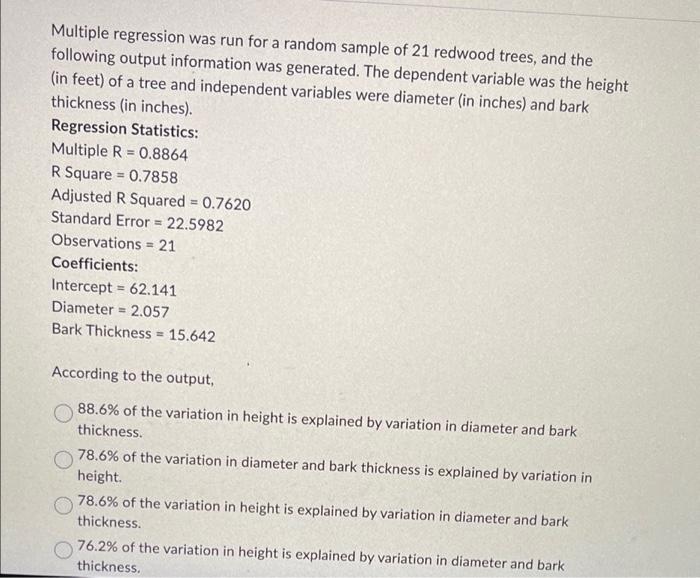
image text in transcribed
Multiple regression was run for a random sample of 21 redwood trees, and the following output information was generated. The dependent variable was the height (in feet) of a tree and independent variables were diameter (in inches) and bark thickness (in inches). Regression Statistics: Multiple R=0.8864 R Square =0.7858 Adjusted R Squared =0.7620 Standard Error =22.5982 Observations =21 Coefficients: Intercept =62.141 Diameter =2.057 Bark Thickness =15.642 According to the output, 88.6% of the variation in height is explained by variation in diameter and bark thickness. 78.6% of the variation in diameter and bark thickness is explained by variation in height. 78.6% of the variation in height is explained by variation in diameter and bark thickness. 76.2% of the variation in height is explained by variation in diameter and bark thickness

Step by Step Solution

There are 3 Steps involved in it

Step: 1

blur-text-image

Get Instant Access to Expert-Tailored Solutions

See step-by-step solutions with expert insights and AI powered tools for academic success

Step: 2

blur-text-image

Step: 3

blur-text-image

Ace Your Homework with AI

Get the answers you need in no time with our AI-driven, step-by-step assistance

Get Started

Recommended Textbook for

Managerial Accounting Tools for business decision making

Authors: Jerry J. Weygandt, Paul D. Kimmel, Donald E. Kieso

6th Edition

978-0470477144, 1118096894, 9781118214657, 470477148, 111821465X, 978-1118096895

More Books

Students also viewed these Accounting questions