Question
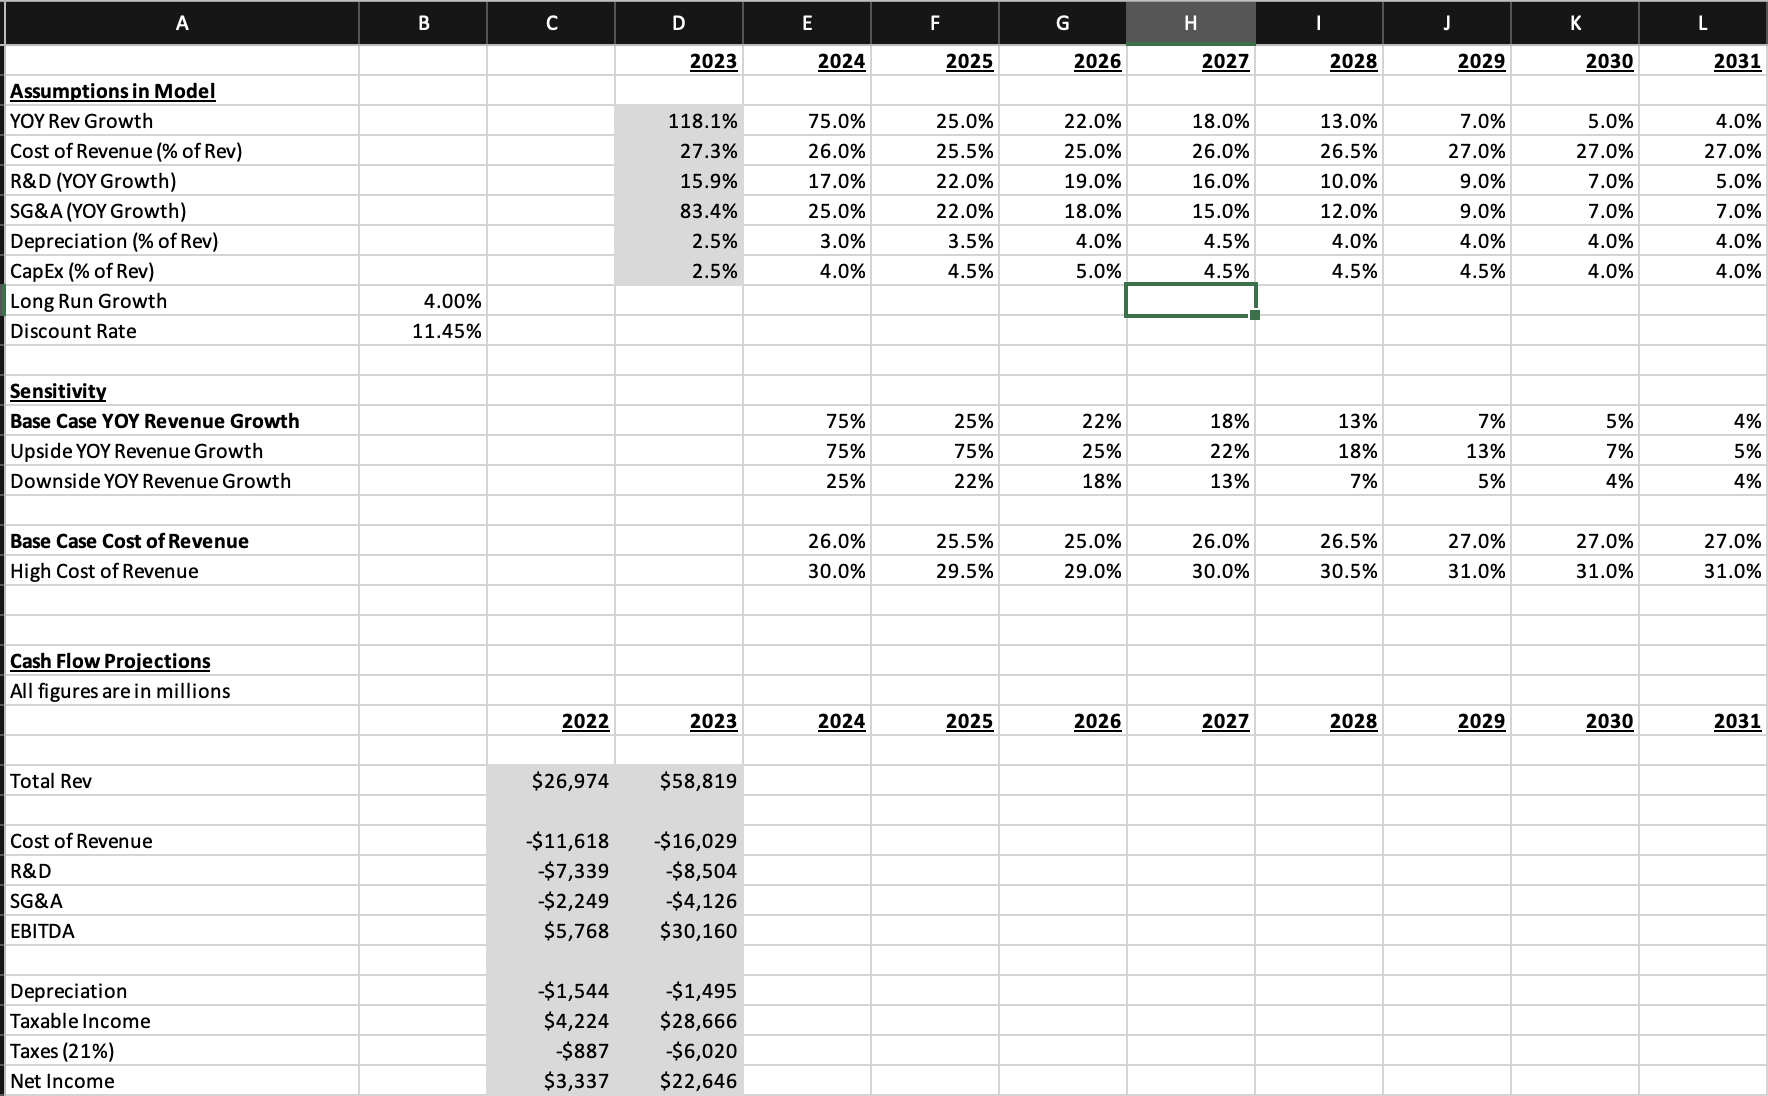
Multiples valuation should be forward looking, so start with Nvidia's 2024 projected Earnings Before Interest, Taxes, Depreciation and Amortization (EBITDA, a standard cash flow measure)
Multiples valuation should be forward looking, so start with Nvidia's 2024 projected Earnings Before Interest, Taxes, Depreciation and Amortization (EBITDA, a standard cash flow measure) and compute its total Equity Value to EBITDA ratio. b. Compare this ratio with the ratios of the following group of chip makers: AMD (AMD, Equity/EBITDA of 70), Intel (INTC, Equity/EBITDA 13.9), and Qualcomm (QCOM, Equity/EBITDA 16.31). c. If you were to apply the average multiple from the comparison group to Nvidia's 2024 EBITDA, what stock price would that imply? (Take 2024 EBITDA x Avg Multiple as your new total Equity Value and divide by shares outstanding.)

A B C D E F G H | J K L 2023 2024 2025 2026 2027 2028 2029 2030 2031 Assumptions in Model YOY Rev Growth Cost of Revenue (% of Rev) R&D (YOY Growth) SG&A (YOY Growth) Depreciation (% of Rev) CapEx (% of Rev) Long Run Growth Discount Rate Sensitivity Base Case YOY Revenue Growth Upside YOY Revenue Growth Downside YOY Revenue Growth Base Case Cost of Revenue High Cost of Revenue Cash Flow Projections All figures are in millions 118.1% 75.0% 25.0% 22.0% 18.0% 13.0% 7.0% 5.0% 4.0% 27.3% 26.0% 25.5% 25.0% 26.0% 26.5% 27.0% 27.0% 27.0% 15.9% 17.0% 22.0% 19.0% 16.0% 10.0% 9.0% 7.0% 5.0% 83.4% 25.0% 22.0% 18.0% 15.0% 12.0% 9.0% 7.0% 7.0% 2.5% 3.0% 3.5% 4.0% 4.5% 4.0% 4.0% 4.0% 4.0% 2.5% 4.0% 4.5% 5.0% 4.5% 4.5% 4.5% 4.0% 4.0% 4.00% 11.45% 75% 25% 22% 18% 13% 7% 5% 4% 75% 75% 25% 22% 18% 13% 7% 5% 25% 22% 18% 13% 7% 5% 4% 4% 26.0% 25.5% 25.0% 26.0% 26.5% 27.0% 27.0% 27.0% 30.0% 29.5% 29.0% 30.0% 30.5% 31.0% 31.0% 31.0% 2022 2023 2024 2025 2026 2027 2028 2029 2030 2031 Total Rev $26,974 $58,819 Cost of Revenue R&D -$11,618 -$16,029 -$7,339 -$8,504 SG&A EBITDA -$2,249 -$4,126 $5,768 $30,160 Depreciation -$1,544 -$1,495 Taxable Income $4,224 $28,666 Taxes (21%) -$887 -$6,020 Net Income $3,337 $22,646
Step by Step Solution
There are 3 Steps involved in it
Step: 1

Get Instant Access to Expert-Tailored Solutions
See step-by-step solutions with expert insights and AI powered tools for academic success
Step: 2

Step: 3

Ace Your Homework with AI
Get the answers you need in no time with our AI-driven, step-by-step assistance
Get Started


