 Must be in Excel formulas
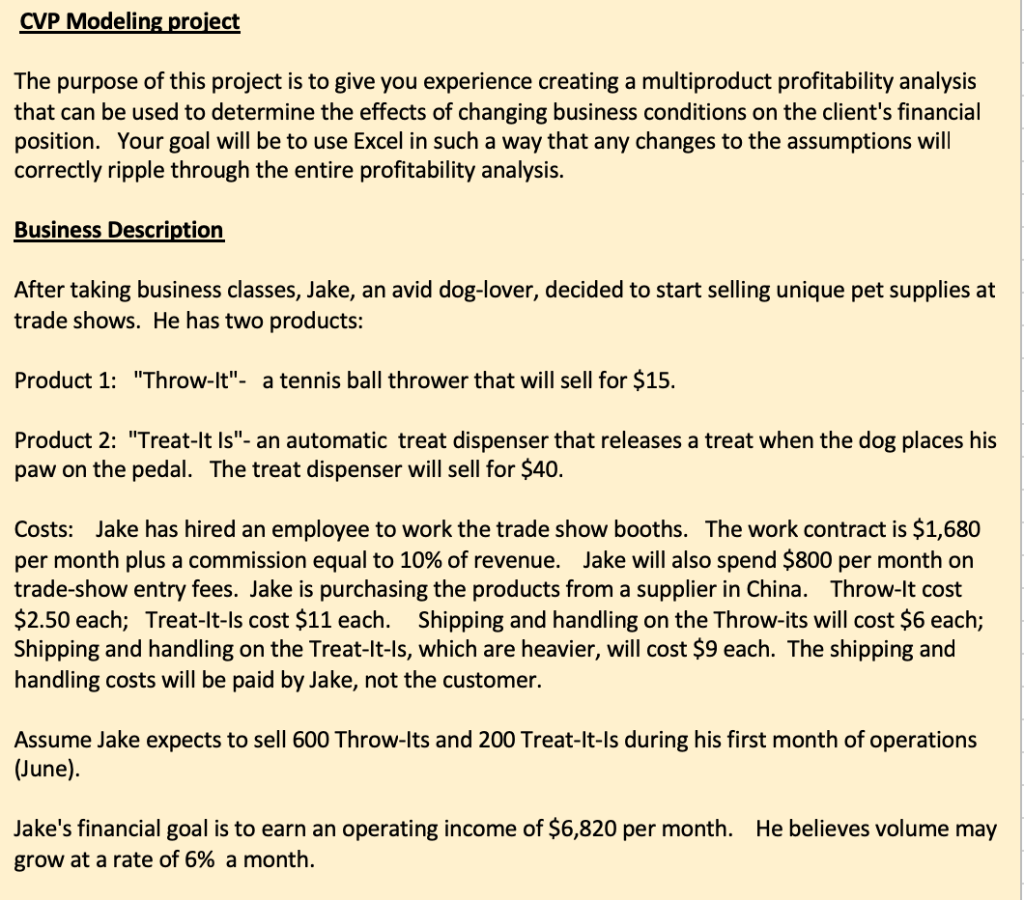
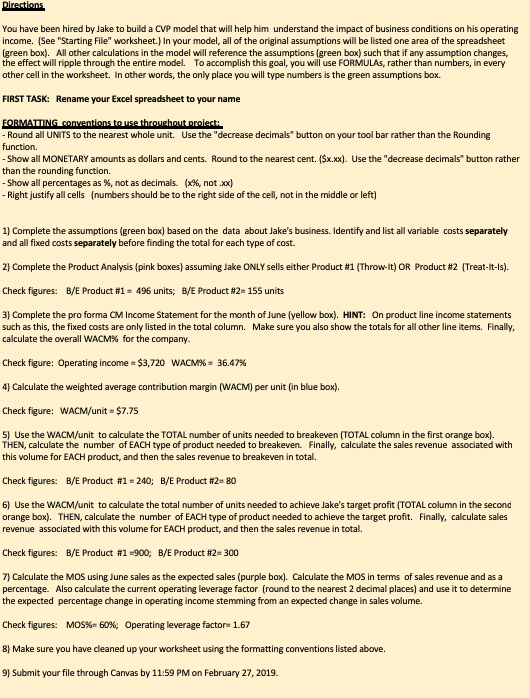
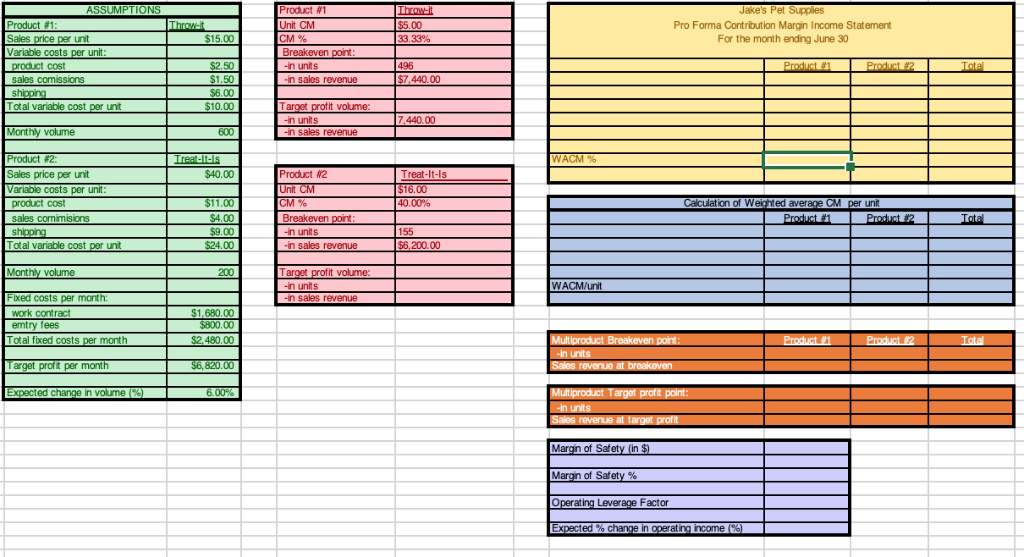
CVP Modeling project The purpose of this project is to give you experience creating a multiproduct profitability analysis that can be used to determine the effects of changing business conditions on the client's financial position. Your goal will be to use Excel in such a way that any changes to the assumptions will correctly ripple through the entire profitability analysis. Business Description After taking business classes, Jake, an avid dog-lover, decided to start selling unique pet supplies at trade shows. He has two products: Product 1: "Throw-lt"- a tennis ball thrower that will sell for $15. Product 2: "Treat-It Is"-an automatic treat dispenser that releases a treat when the dog places his paw on the pedal. The treat dispenser will sell for $40. Costs: Jake has hired an employee to work the trade show booths. The work contract is $1,680 per month plus a commission equal to 10% of revenue. Jake will also spend $800 per month on trade-show entry fees. Jake is purchasing the products from a supplier in China. Throw-lt cost $2.50 each; Treat-It-ls cost $11 each. Shipping and handling on the Throw-its will cost $6 each; Shipping and handling on the Treat-lt-ls, which are heavier, will cost $9 each. The shipping and handling costs will be paid by Jake, not the customer. Assume Jake expects to sell 600 Throw-lts and 200 Treat-It-ls during his first month of operations (June) Jake's financial goal is to earn an operating income of $6,820 per month. He believes volume may grow at a rate of 6% a month. You have been hired by Jake to build a CVP model that will help him understand the impact of business conditions on his operating income. (See "Starting File" worksheet.) In your model, all of the original assumptions will be listed one area of the spreadsheet (green box). All other calculations in the model will reference the assumptions (green box) such that if any assumption changes, the effect will ripple through the entire model. To accomplish this goal, you will use FORMULAs, rather than numbers, in every other cell in the worksheet. In other words, the only place you will type numbers is the green assumptions box. FIRST TASK: Rename your Excel s to your name Round all UNITS to the nearest whole unit. Use the "decrease decimals" button on your tool bar rather than the Rounding Show all MONETARY amounts as dollars and cents. Round to the nearest cent. ($x.xx). Use the "decrease decimals button rather Show all percentages as %, not as decimals. (x%, not .xx) function. than the rounding function. Right justify all cells (numbers should be to the right side of the cell, not in the middle or left) 1) Complete the assumptions (green box) based on the data about Jake's business. Identify and list all variable costs separately and all fixed costs separately before finding the total for each type of cost. 2) Complete the Product Analysis (pink boxes) assuming Jake ONLY sells either Product #1 (Throw-it) OR Product #2 (Treat-it-ls). Check figures: B/E Product #1 496 units; B/E Product #2-155 units 3) Complete the pro forma CM Income Statement for the month of June (yellow box). HINT: On product line income statements such as this, the fixed costs are only listed in the total column. Make sure you also show the totals for all other line items. Finally, calculate the overall WACM% for the c ompamy Check figure: Operating income-$3,720 wACM%-36.47% 4) Calculate the weighted average contribution margin (WACM) per unit (in blue box). Check figure: WACM/unit $7.75 5) Use the WACM/unit to calculate the TOTAL number of units needed to breakeven (TOTAL column in the first orange box). THEN, calculate the number of EACH type of product needed to breakeven. Finally, calculate the sales revenue associated with this volume for EACH product, and then the sales revenue to breakeven in total. Check figures: B/E Product #1-240; B/E Product #2-80 6) Use the WACM/unit to calculate the total number of units needed to achieve Jake's target profit (TOTAL column in the second orange box). THEN, calculate the number of EACH type of product needed to achieve the target profit. Finally, calculate sales revenue associated with this volume for EACH product, and then the sales revenue in total. Check figures: B/E Product #1-900; B/E Product #2-300 7 Calculate the MOS using June sales as the expected sales (purple box). Calculate the MOS in terms of sales revenue and as a percentage. Also calculate the current operating leverage factor (round to the nearest 2 decimal places) and use it to determine the expected percentage change in operating income stemming from an expected change in sales wolume. Check figures: M05% 60%; Operating leverage factors 1.67 8) Make sure you have cleaned up your worksheet using the formatting conventions listed above. 9) Submit your file through Canvas by 11:59 PM on February 27, 2019. Product #1 Unit CM Product #1 $5.00 Pro Forma Contribution Margin Income Statement For the month ending June 30 15.00 M% ales price per unit Variable costs per unit Breakeven ct cost $2.50 n unis 496 sales comissions n sales rovenue 440.00 $6.00 10.00 otal variable cost unt ar ofit volume 600 Product #2 WACM % Sales price per unit $40.00 Product #2 Treat-It-Is 16.00 Unit CM ariable costs per un product cost sales commisions 40.00% of Weighted average CM per uni Breakeven n units $9.00 155 otal variable cost unt Monthy volume 200 -n unis WACM/unit xed costs per month work cont ract 680.00 0.00 ot al fixed costs per month xpected change in volume at t Margin of Safety (in Maran of Safety % perating Leverage Factor Expected % change in operating nome