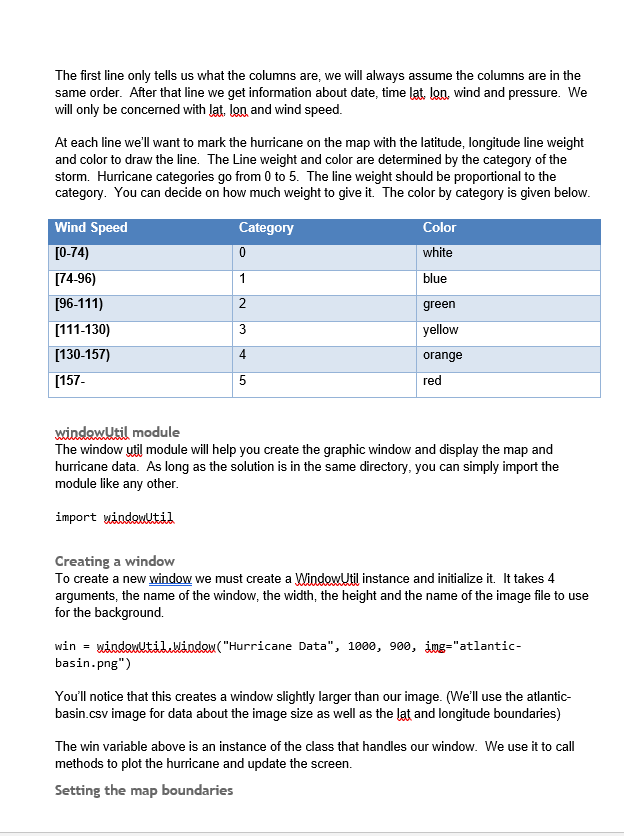
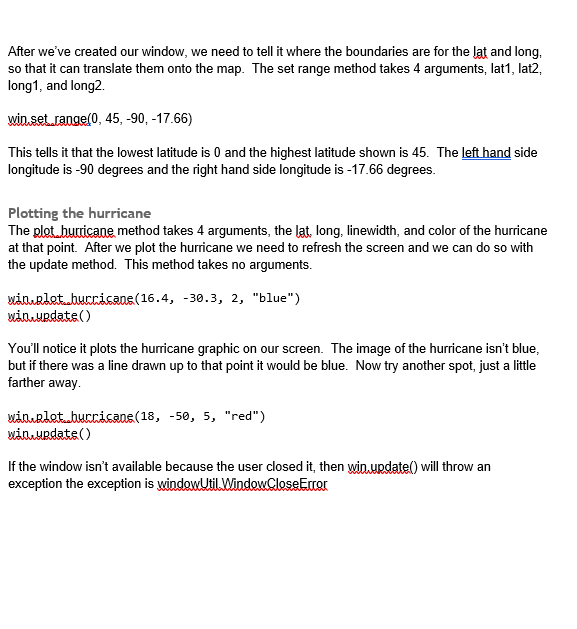
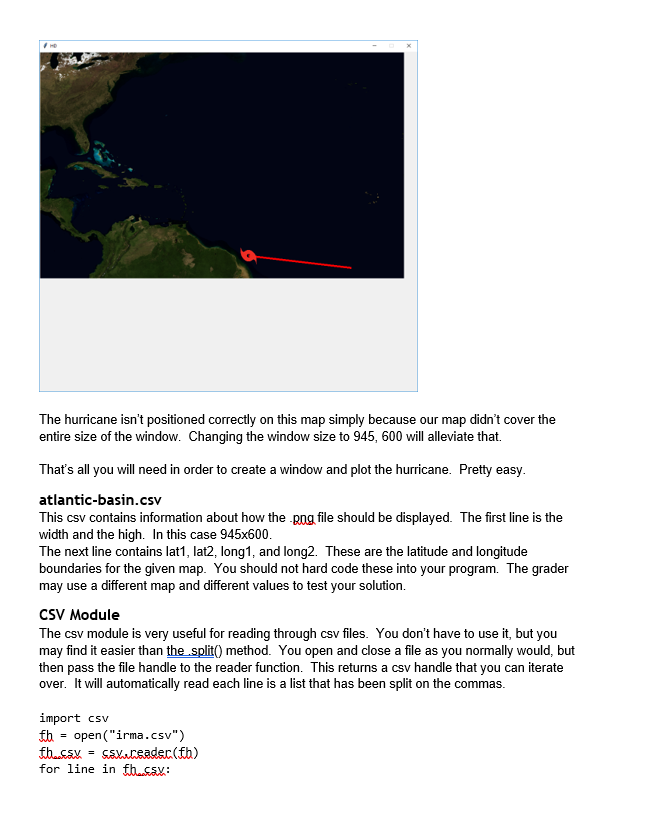
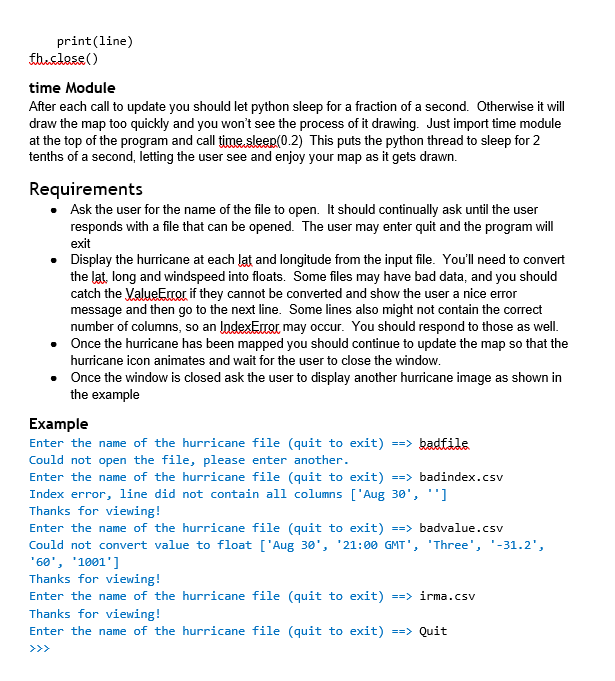
Must be in Python. Use functions to modularize your work in a logical way. Hurricane Plotting This project will have you using error handling and file handling to plot the path of hurricanes. The zip file contains all the data files, images and modules you will need for the program. The datafiles are csv, you may find using the csv module easier to use. However, you can always read in a line and use. split. Below is the image for hurricane ima path. This image is not complete as there are more datapoints that haven't been drawn yet. Hurricane.csv files. There are multiple csv files for different named hurricanes. (The atlantic-basin.csv file is not a storm file, but contains region information about the map. More about that later.). Each line in the storm csv file contains information about the storm at a particular point and time. The first 4 lines of irma.csv appear in below Date. Time. Lat Lon wind, Pressure Aug 30,15:00 GMT,16.4,-30.3,50,1904 Aug 30,21:00 GMT, 16.4-31.2,60,1001 Aug 31,03:00 GMT,16.4,-32.2,65,999 The first line only tells us what the columns are, we will always assume the columns are in the same order. After that line we get information about date, time lat lon. wind and pressure. We will only be concerned with lat, lon and wind speed At each line we'll want to mark the hurricane on the map with the latitude, longitude line weight and color to draw the line. The Line weight and color are determined by the category of the storm. Hurricane categories go from 0 to 5. The line weight should category. You can decide on how much weight to give it. The color by category is given below be proportional to the Wind Speed [0-74) [74-96) Category Color white ue [111-130) [130-157) 1157 green yellow orange red 4 5 windewUtil module The window util module will help you create the graphic window and display the map and hurricane data. As long as the solution is in the same directory, you can simply import the module like any other import uindoulltil Creating a window To create a new window we must create a WindowUtil instance and initialize it. It takes 4 arguments, the name of the window, the width, the height and the name of the image file to use for the background. win - wiadouutilulindow("Hurricane Data", 1000, 900, iug-"atlantic- basin.png") You'll notice that this creates a window slightly larger than our image. (We'll use the atlantic- basin.csv image for data about the image size as well as the lat and longitude boundaries) The win variable above is an instance of the class that handles our window. We use it to call methods to plot the hurricane and update the screen Setting the map boundaries After we've created our window, we need to tell it where the boundaries are for the lat and long, so that it can translate them onto the map. The set range method takes 4 arguments, lat1, lat2, long1, and long2. win.set ranae(0, 45, -90,-17.66) This tells it that the lowest latitude is 0 and the highest latitude shown is 45. The left hand side longitude is -90 degrees and the right hand side longitude is -17.66 degrees. Plotting the hurricane The plot buricane method takes 4 arguments, the lat, long, linewidth, and color of the hurricane at that point. After we plot the hurricane we need to refresh the screen and we can do so with the update method. This method takes no arguments. winRletbucricane(16.4, -30.3, 2, "blue") You'll notice it plots the hurricane graphic on our screen. The image of the hurricane isn't blue, but if there was a line drawn up to that point it would be blue. Now try another spot, just a little farther away. winaRletbucricane(18, -50, 5, "red") If the window isn't available because the user closed it, then win,update) will throw an exception the exception is windowltil.WindowCloseErrar The hurricane isn't positioned correctly on this map simply because our map didn't cover the entire size of the window. Changing the window size to 945 600l aleviate that That's all you will need in order to create a window and plot the hurricane. Pretty easy. atlantic-basin.csv This csv contains information about how the pog file should be displayed. The first line is the width and the high. In this case 945x600 The next line contains lat1, lat2, long1, and long2. These are the latitude and longitude boundaries for the given map. You should not hard code these into your program. The grader may use a different map and different values to test your solution. CSV Module The csv module is very useful for reading through csv files. You don't have to use it, but you may find it easier than the.split(0 method. You open and close a file as you normally would, but then pass the file handle to the reader function. This returns a csv handle that you can iterate over. It will automatically read each line is a list that has been split on the commas. import csv fh-open("irma.csv") fh.csx sax.ceader(th) for line in thax print(line) time Module After each call to update you should let python sleep for a fraction of a second. Otherwise it will draw the map too quickly and you won't see the process of it drawing. Just import time module at the top of the program and call time.sleep(02) This puts the python thread to sleep for 2 tenths of a second, letting the user see and enjoy your map as it gets drawn Requirements Ask the user for the name of the file to open. It should continually ask until the user responds with a file that can be opened. The user may enter quit and the program will exit Display the hurricane at each lat and longitude from the input file. You'll need to convert the lat, long and windspeed into floats. Some files may have bad data, and you should catch the ValueError if they cannot be converted and show the user a nice error message and then go to the next line. Some lines also might not contain the correct number of columns, so an lndexErxor may occur. You should respond to those as well Once the hurricane has been mapped you should continue to update the map so that the hurricane icon animates and wait for the user to close the window Once the window is closed ask the user to display another hurricane image as shown in the example . . Example Enter the name of the hurricane file (quit to exit) > badfile Could not open the file, please enter another. Enter the name of the hurricane file (quit to exit)> badindex.csv Index error, line did not contain all columns ['Aug 30*,"] Thanks for viewing! Enter the name of the hurricane file (quit to exit) badvalue.csv Could not convert value to float ['Aug 30 '21:00 GMT', 'Three, 31.2', 60', 1001 Thanks for viewing! Enter the name of the hurricane file (quit to exit) > irma.csv Thanks for viewing Enter the name of the hurricane file (quit to exit) Quit >y Must be in Python. Use functions to modularize your work in a logical way. Hurricane Plotting This project will have you using error handling and file handling to plot the path of hurricanes. The zip file contains all the data files, images and modules you will need for the program. The datafiles are csv, you may find using the csv module easier to use. However, you can always read in a line and use. split. Below is the image for hurricane ima path. This image is not complete as there are more datapoints that haven't been drawn yet. Hurricane.csv files. There are multiple csv files for different named hurricanes. (The atlantic-basin.csv file is not a storm file, but contains region information about the map. More about that later.). Each line in the storm csv file contains information about the storm at a particular point and time. The first 4 lines of irma.csv appear in below Date. Time. Lat Lon wind, Pressure Aug 30,15:00 GMT,16.4,-30.3,50,1904 Aug 30,21:00 GMT, 16.4-31.2,60,1001 Aug 31,03:00 GMT,16.4,-32.2,65,999 The first line only tells us what the columns are, we will always assume the columns are in the same order. After that line we get information about date, time lat lon. wind and pressure. We will only be concerned with lat, lon and wind speed At each line we'll want to mark the hurricane on the map with the latitude, longitude line weight and color to draw the line. The Line weight and color are determined by the category of the storm. Hurricane categories go from 0 to 5. The line weight should category. You can decide on how much weight to give it. The color by category is given below be proportional to the Wind Speed [0-74) [74-96) Category Color white ue [111-130) [130-157) 1157 green yellow orange red 4 5 windewUtil module The window util module will help you create the graphic window and display the map and hurricane data. As long as the solution is in the same directory, you can simply import the module like any other import uindoulltil Creating a window To create a new window we must create a WindowUtil instance and initialize it. It takes 4 arguments, the name of the window, the width, the height and the name of the image file to use for the background. win - wiadouutilulindow("Hurricane Data", 1000, 900, iug-"atlantic- basin.png") You'll notice that this creates a window slightly larger than our image. (We'll use the atlantic- basin.csv image for data about the image size as well as the lat and longitude boundaries) The win variable above is an instance of the class that handles our window. We use it to call methods to plot the hurricane and update the screen Setting the map boundaries After we've created our window, we need to tell it where the boundaries are for the lat and long, so that it can translate them onto the map. The set range method takes 4 arguments, lat1, lat2, long1, and long2. win.set ranae(0, 45, -90,-17.66) This tells it that the lowest latitude is 0 and the highest latitude shown is 45. The left hand side longitude is -90 degrees and the right hand side longitude is -17.66 degrees. Plotting the hurricane The plot buricane method takes 4 arguments, the lat, long, linewidth, and color of the hurricane at that point. After we plot the hurricane we need to refresh the screen and we can do so with the update method. This method takes no arguments. winRletbucricane(16.4, -30.3, 2, "blue") You'll notice it plots the hurricane graphic on our screen. The image of the hurricane isn't blue, but if there was a line drawn up to that point it would be blue. Now try another spot, just a little farther away. winaRletbucricane(18, -50, 5, "red") If the window isn't available because the user closed it, then win,update) will throw an exception the exception is windowltil.WindowCloseErrar The hurricane isn't positioned correctly on this map simply because our map didn't cover the entire size of the window. Changing the window size to 945 600l aleviate that That's all you will need in order to create a window and plot the hurricane. Pretty easy. atlantic-basin.csv This csv contains information about how the pog file should be displayed. The first line is the width and the high. In this case 945x600 The next line contains lat1, lat2, long1, and long2. These are the latitude and longitude boundaries for the given map. You should not hard code these into your program. The grader may use a different map and different values to test your solution. CSV Module The csv module is very useful for reading through csv files. You don't have to use it, but you may find it easier than the.split(0 method. You open and close a file as you normally would, but then pass the file handle to the reader function. This returns a csv handle that you can iterate over. It will automatically read each line is a list that has been split on the commas. import csv fh-open("irma.csv") fh.csx sax.ceader(th) for line in thax print(line) time Module After each call to update you should let python sleep for a fraction of a second. Otherwise it will draw the map too quickly and you won't see the process of it drawing. Just import time module at the top of the program and call time.sleep(02) This puts the python thread to sleep for 2 tenths of a second, letting the user see and enjoy your map as it gets drawn Requirements Ask the user for the name of the file to open. It should continually ask until the user responds with a file that can be opened. The user may enter quit and the program will exit Display the hurricane at each lat and longitude from the input file. You'll need to convert the lat, long and windspeed into floats. Some files may have bad data, and you should catch the ValueError if they cannot be converted and show the user a nice error message and then go to the next line. Some lines also might not contain the correct number of columns, so an lndexErxor may occur. You should respond to those as well Once the hurricane has been mapped you should continue to update the map so that the hurricane icon animates and wait for the user to close the window Once the window is closed ask the user to display another hurricane image as shown in the example . . Example Enter the name of the hurricane file (quit to exit) > badfile Could not open the file, please enter another. Enter the name of the hurricane file (quit to exit)> badindex.csv Index error, line did not contain all columns ['Aug 30*,"] Thanks for viewing! Enter the name of the hurricane file (quit to exit) badvalue.csv Could not convert value to float ['Aug 30 '21:00 GMT', 'Three, 31.2', 60', 1001 Thanks for viewing! Enter the name of the hurricane file (quit to exit) > irma.csv Thanks for viewing Enter the name of the hurricane file (quit to exit) Quit >y


