

Answered step by step
Verified Expert Solution
Question
1 Approved Answer
must show work please HW 5 - Chapter 5 - Part 1 Analyzing Mixed Costs Exercise 5A-2 Least-Squares Regression Bargain Rental Car offers rental cars
must show work please
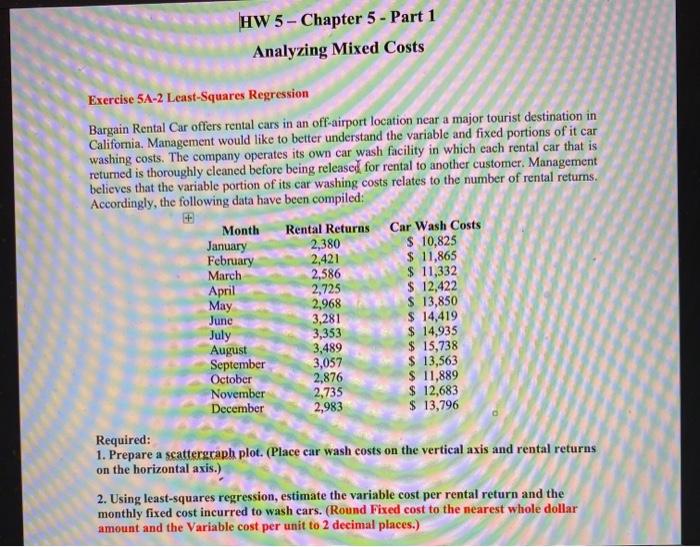
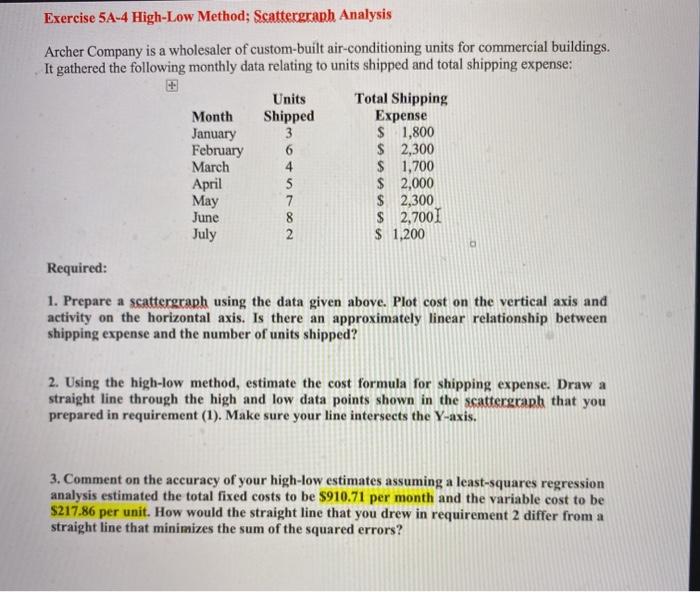
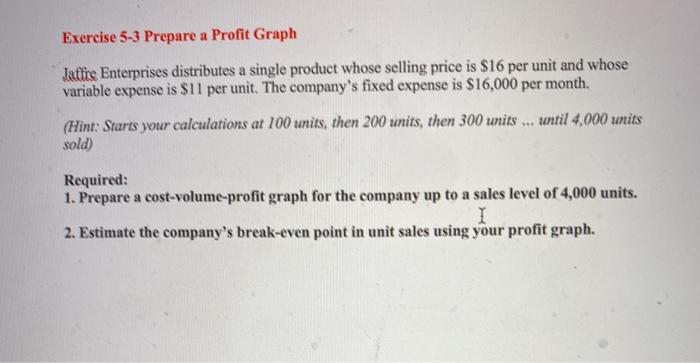
HW 5 - Chapter 5 - Part 1 Analyzing Mixed Costs Exercise 5A-2 Least-Squares Regression Bargain Rental Car offers rental cars in an off-airport location near a major tourist destination in California. Management would like to better understand the variable and fixed portions of it car washing costs. The company operates its own car wash facility in which each rental car that is returned is thoroughly cleaned before being released for rental to another customer. Management believes that the variable portion of its car washing costs relates to the number of rental returns. Accordingly, the following data have been compiled: Month Rental Returns Car Wash Costs January 2,380 $ 10,825 February 2,421 $ 11,865 March 2,586 $ 11,332 April 2,725 $ 12,422 May 2,968 $ 13,850 June 3,281 $ 14,419 July 3,353 $ 14,935 August 3,489 $ 15,738 September 3,057 $ 13,563 October 2,876 $ 11,889 November 2,735 $ 12,683 December 2,983 $ 13,796 Required: 1. Prepare a scattergraph plot. (Place car wash costs on the vertical axis and rental returns on the horizontal axis.) 2. Using least-squares regression, estimate the variable cost per rental return and the monthly fixed cost incurred to wash cars. (Round Fixed cost to the nearest whole dollar amount and the Variable cost per unit to 2 decimal places.) Exercise 5A-4 High-Low Method; Scattergraph Analysis Archer Company is a wholesaler of custom-built air-conditioning units for commercial buildings. It gathered the following monthly data relating to units shipped and total shipping expense: Month January February March April May June July Units Shipped 3 6 4 5 7 8 2 Total Shipping Expense $ 1,800 $ 2,300 $ 1,700 $ 2,000 $ 2,300 $ 2,7001 $ 1,200 Required: 1. Prepare a scattergraph using the data given above. Plot cost on the vertical axis and activity on the horizontal axis. Is there an approximately linear relationship between shipping expense and the number of units shipped? 2. Using the high-low method, estimate the cost formula for shipping expense. Draw a straight line through the high and low data points shown in the scattergraph that you prepared in requirement (1). Make sure your line intersects the Y-axis. 3. Comment on the accuracy of your high-low estimates assuming a least-squares regression analysis estimated the total fixed costs to be $910.71 per month and the variable cost to be $217.86 per unit. How would the straight line that you drew in requirement 2 differ from a straight line that minimizes the sum of the squared errors? Exercise 5-3 Prepare a Profit Graph Jattie Enterprises distributes a single product whose selling price is $16 per unit and whose variable expense is $11 per unit. The company's fixed expense is $16,000 per month. (Hint: Starts your calculations at 100 units, then 200 units, then 300 units .... until 4,000 units sold) Required: 1. Prepare a cost-volume-profit graph for the company up to a sales level of 4,000 units. I 2. Estimate the company's break-even point in unit sales using your profit graph. HW 5 - Chapter 5 - Part 1 Analyzing Mixed Costs Exercise 5A-2 Least-Squares Regression Bargain Rental Car offers rental cars in an off-airport location near a major tourist destination in California. Management would like to better understand the variable and fixed portions of it car washing costs. The company operates its own car wash facility in which each rental car that is returned is thoroughly cleaned before being released for rental to another customer. Management believes that the variable portion of its car washing costs relates to the number of rental returns. Accordingly, the following data have been compiled: Month Rental Returns Car Wash Costs January 2,380 $ 10,825 February 2,421 $ 11,865 March 2,586 $ 11,332 April 2,725 $ 12,422 May 2,968 $ 13,850 June 3,281 $ 14,419 July 3,353 $ 14,935 August 3,489 $ 15,738 September 3,057 $ 13,563 October 2,876 $ 11,889 November 2,735 $ 12,683 December 2,983 $ 13,796 Required: 1. Prepare a scattergraph plot. (Place car wash costs on the vertical axis and rental returns on the horizontal axis.) 2. Using least-squares regression, estimate the variable cost per rental return and the monthly fixed cost incurred to wash cars. (Round Fixed cost to the nearest whole dollar amount and the Variable cost per unit to 2 decimal places.) Exercise 5A-4 High-Low Method; Scattergraph Analysis Archer Company is a wholesaler of custom-built air-conditioning units for commercial buildings. It gathered the following monthly data relating to units shipped and total shipping expense: Month January February March April May June July Units Shipped 3 6 4 5 7 8 2 Total Shipping Expense $ 1,800 $ 2,300 $ 1,700 $ 2,000 $ 2,300 $ 2,7001 $ 1,200 Required: 1. Prepare a scattergraph using the data given above. Plot cost on the vertical axis and activity on the horizontal axis. Is there an approximately linear relationship between shipping expense and the number of units shipped? 2. Using the high-low method, estimate the cost formula for shipping expense. Draw a straight line through the high and low data points shown in the scattergraph that you prepared in requirement (1). Make sure your line intersects the Y-axis. 3. Comment on the accuracy of your high-low estimates assuming a least-squares regression analysis estimated the total fixed costs to be $910.71 per month and the variable cost to be $217.86 per unit. How would the straight line that you drew in requirement 2 differ from a straight line that minimizes the sum of the squared errors? Exercise 5-3 Prepare a Profit Graph Jattie Enterprises distributes a single product whose selling price is $16 per unit and whose variable expense is $11 per unit. The company's fixed expense is $16,000 per month. (Hint: Starts your calculations at 100 units, then 200 units, then 300 units .... until 4,000 units sold) Required: 1. Prepare a cost-volume-profit graph for the company up to a sales level of 4,000 units. I 2. Estimate the company's break-even point in unit sales using your profit graph Step by Step Solution
There are 3 Steps involved in it
Step: 1

Get Instant Access to Expert-Tailored Solutions
See step-by-step solutions with expert insights and AI powered tools for academic success
Step: 2

Step: 3
Ace Your Homework with AI
Get the answers you need in no time with our AI-driven, step-by-step assistance
Get Started
Unknown Market Wizards The Best Traders Youve Never Heard Of
Authors: Jack D. Schwager
1st Edition
0857198718, 978-0857198716