My chosen company is Ferrexpo.
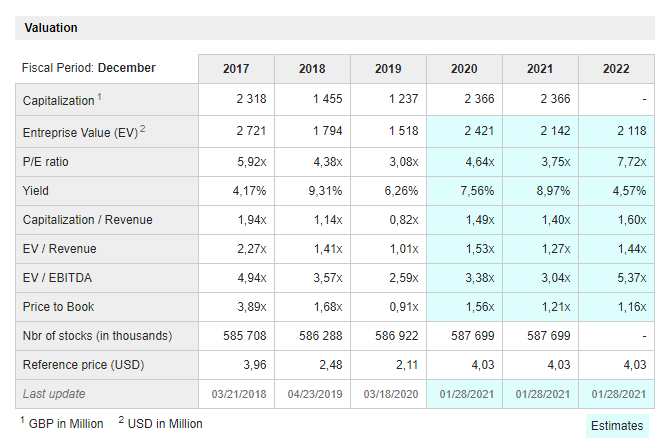
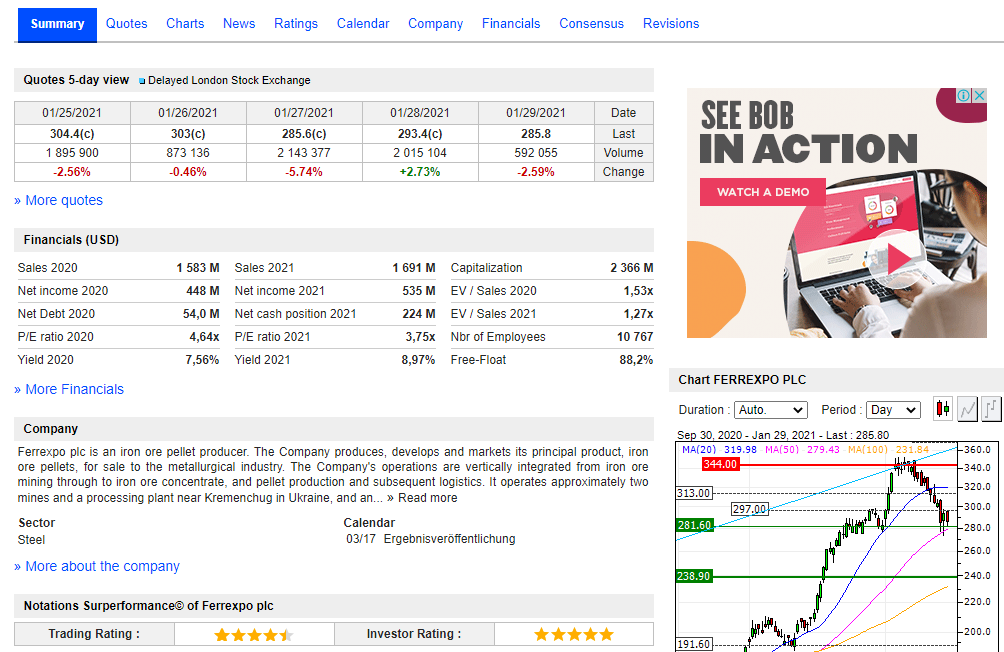
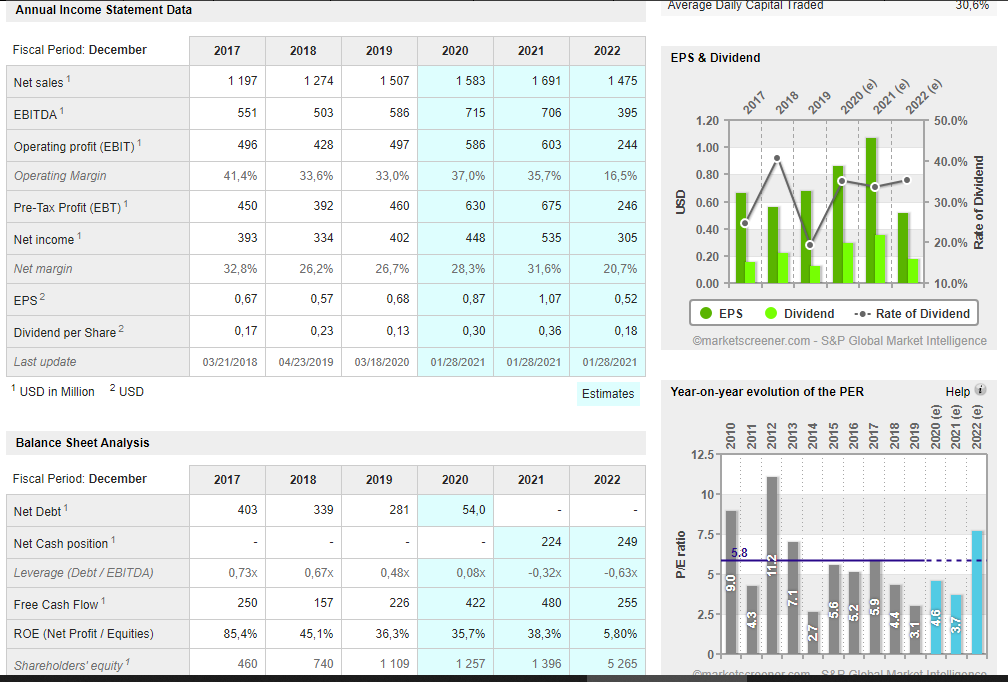
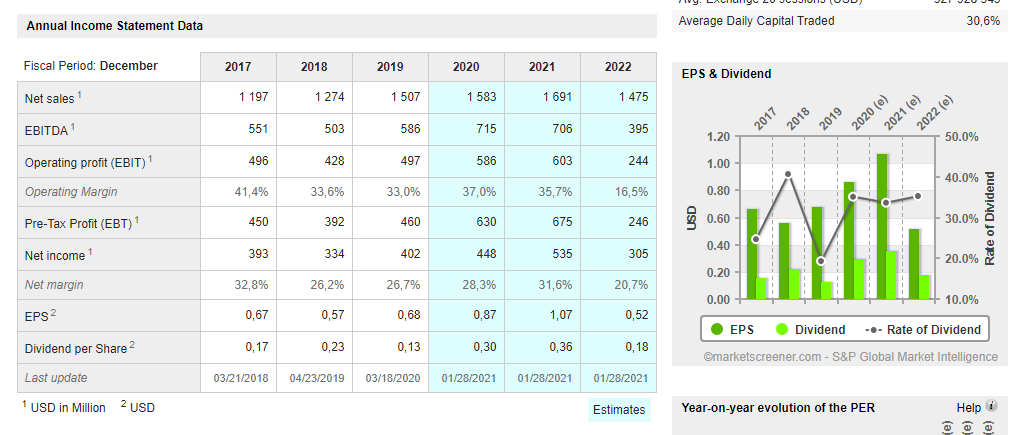
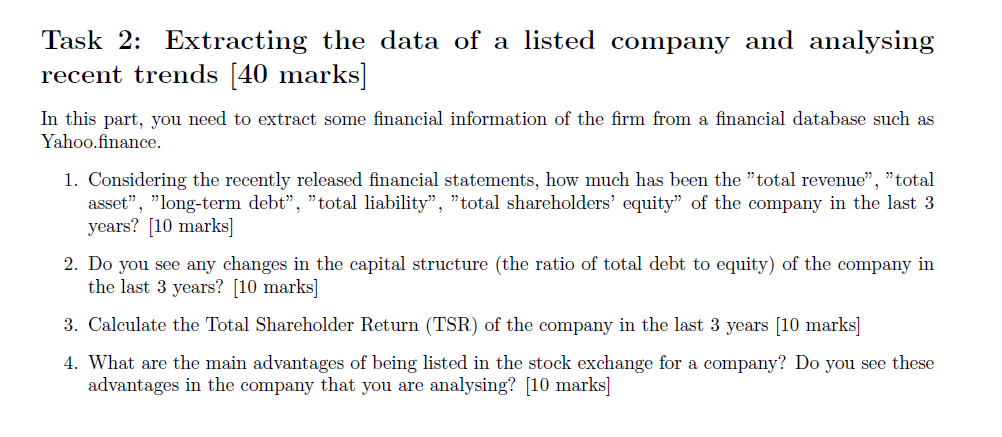
Task 2: Extracting the data of a listed company and analysing recent trends [40 marks] In this part, you need to extract some financial information of the firm from a financial database such as Yahoo.finance. 1. Considering the recently released financial statements, how much has been the "total revenue, "total "long-term debt, total liability", "total shareholders' equity" of the company in the last 3 years? (10 marks) 2. Do you see any changes in the capital structure (the ratio of total debt to equity) of the company in the last 3 years? (10 marks] 3. Calculate the Total Shareholder Return (TSR) of the company in the last 3 years [10 marks] 4. What are the main advantages of being listed in the stock exchange for a company? Do you see these advantages in the company that you are analysing? (10 marks] asset", Valuation Fiscal Period: December 2017 2018 2019 2020 2021 2022 Capitalization 2 318 1 455 1 237 2 366 2 366 Entreprise Value (EV) 2 721 1 794 1 518 2421 2 142 2 118 P/E ratio 5,92% 4,38x 3,08x 4,64x 3,75x 7,72x Yield 4,17% 9,31% 6,26% 7,56% 8,97% 4,57% Capitalization / Revenue 1,94x 1,14x 0,82% 1,49x 1,40x 1,60% EV / Revenue 2,27x 1,41x 1,01% 1,53x 1,27x 1,44x 4,94x 3,57x 2,59x 3,38% 3,04x 5,37x EV / EBITDA Price to Book 3,89% 1,68X 0,91x 1,56% 1,21x 1,16x Nbr of stocks (in thousands) 585 708 586 288 586 922 587 699 587 699 Reference price (USD) 3,96 2,48 2,11 4,03 4,03 4,03 Last update 03/21/2018 04/23/2019 03/18/2020 01/28/2021 01/28/2021 01/28/2021 1 GBP in Million 2 USD in Million Estimates Summary Quotes Charts News Ratings Calendar Company Financials Consensus Revisions Quotes 5-day view Delayed London Stock Exchange OX 01/25/2021 304.4(c) 1 895 900 -2.56% 01/26/2021 303(c) 873 136 -0.46% 01/27/2021 285.6(c) 2 143 377 -5.74% 01/28/2021 293.4(c) 2015 104 +2.73% 01/29/2021 285.8 592 055 -2.59% Date Last Volume Change SEE BOB IN ACTION WATCH A DEMO >> More quotes Financials (USD) Sales 2020 2 366 M Net income 2020 1,53x Net Debt 2020 P/E ratio 2020 Yield 2020 1 583 M Sales 2021 448 M Net income 2021 54,0 M Net cash position 2021 4,64x P/E ratio 2021 7,56% Yield 2021 1 691 M Capitalization 535 M EV / Sales 2020 224 M EV / Sales 2021 3,75x Nbr of Employees 8,97% Free-Float 1,27x 10 767 88,2% Chart FERREXPO PLC >> More Financials Duration : Auto V Period: Day 0 m Sep 30, 2020 - Jan 29, 2021 - Last : 285.80 MA(20) 319.98 MA(50) 279.43-MA(100) 231.84 344.00 Company Ferrexpo plc is an iron ore pellet producer. The Company produces, develops and markets its principal product, iron ore pellets, for sale to the metallurgical industry. The Company's operations are vertically integrated from iron ore mining through to iron ore concentrate, and pellet production and subsequent logistics. It operates approximately two mines and a processing plant near Kremenchug in Ukraine, and an... >> Read more Sector Calendar Steel 03/17 Ergebnisverffentlichung 313.00 360.0 340.0 320.0 +300.0 +-280.0 297.00 281.60 260.0 >> More about the company 238.90 +240.0 220.0 Notations Surperformance of Ferrexpo plc Trading Rating : Investor Rating: 200.0 191.60 Annual Income Statement Data Average Dally Capital Traded 30,6% Fiscal Period: December 2017 2018 2019 2020 2021 2022 EPS & Dividend Net sales 1 197 1 274 1 507 1 583 1 691 1 475 EBITDA 1 551 503 586 715 706 395 1.20 50.0% Operating profit (EBIT) 496 428 497 586 603 244 1.00 40.0% Operating Margin 41,4% 33,6% 33,0% 37,0% 35,7% 16,5% 0.80 2017 2018 2019 2020 (e) 2021 (e) 2022 (e) Pre-Tax Profit (EBT) 1 450 392 460 630 675 246 g 0.60 with 30.0% Rate of Dividend 0.40 Net income 1 393 334 402 448 535 305 20.0% 0.20 Net margin 32,8% 26,2% 26,7% 28,3% 31,6% 20,7% 0.00 10.0% EPS 2 0,67 0,57 0,68 0,87 1,07 0,52 EPS Dividend -- Rate of Dividend Dividend per Share 2 0,17 0.23 0,13 0,30 0,36 0,18 Omarketscreener.com - S&P Global Market Intelligence Last update 03/21/2018 04/23/2019 03/18/2020 01/28/2021 01/28/2021 01/28/2021 1 USD in Million 2 USD Estimates Year-on-year evolution of the PER Help Balance Sheet Analysis 2010 2011 2012 2013 2014 2015 2016 2018 2019 2020 (e) 2021 (e) 2022 (e) 12.5 Fiscal Period: December 2017 2018 2019 2020 2021 2022 10 Net Debt 403 339 281 54,0 7.5- Net Cash position - - 224 249 P/E ratio 5.8 Leverage (Debt/EBITDA) 0,73x 0,67% 0,48x 0,08x -0,32% -0,63% 5 Free Cash Flow 250 157 226 422 480 255 1..... 12 2.5 5.6 5.2 6'S 4.3 tu ROE (Net Profit / Equities) 85,4% 45,1% 36,3% 35,7% 38,3% 5,80% 3.7 3.1 14.6 0 Shareholders' equity 460 740 1 109 1 257 1 396 5265 Annual Income Statement Data Average Daily Capital Traded 30,6% Fiscal Period: December 2017 2018 2019 2020 2021 2022 EPS & Dividend Net sales 1 197 1 274 1 507 1 583 1 691 1 475 2017 EBITDA 551 503 586 715 706 395 1.20 50.0% Operating profit (EBIT) 496 428 497 586 603 244 1.00 2018 2019 2020 (e) 2021 (e) 2022 (e) 40.0% Operating Margin 41,4% 33,6% 33,0% 37,0% 35,7% 16,5% 0.80 - 1 Pre-Tax Profit (EBT) 450 392 460 630 675 246 0.60 30.0% will Rate of Dividend 0.40 Net income 1 393 334 402 448 535 305 20.0% 0.20 Net margin 32,8% 26,2% 26,7% 28,3% 31,6% 20,7% 1 0.00 10.0% EPS2 0,67 0,57 0,68 0,87 1,07 0,52 EPS Dividend -- Rate of Dividend Dividend per Share 2 0,17 0,23 0,13 0,30 0,36 0,18 marketscreener.com - S&P Global Market Intelligence Last update 03/21/2018 04/23/2019 03/18/2020 01/28/2021 01/28/2021 01/28/2021 1 1 USD in Million 2 USD Estimates Year-on-year evolution of the PER Help ob


