Question
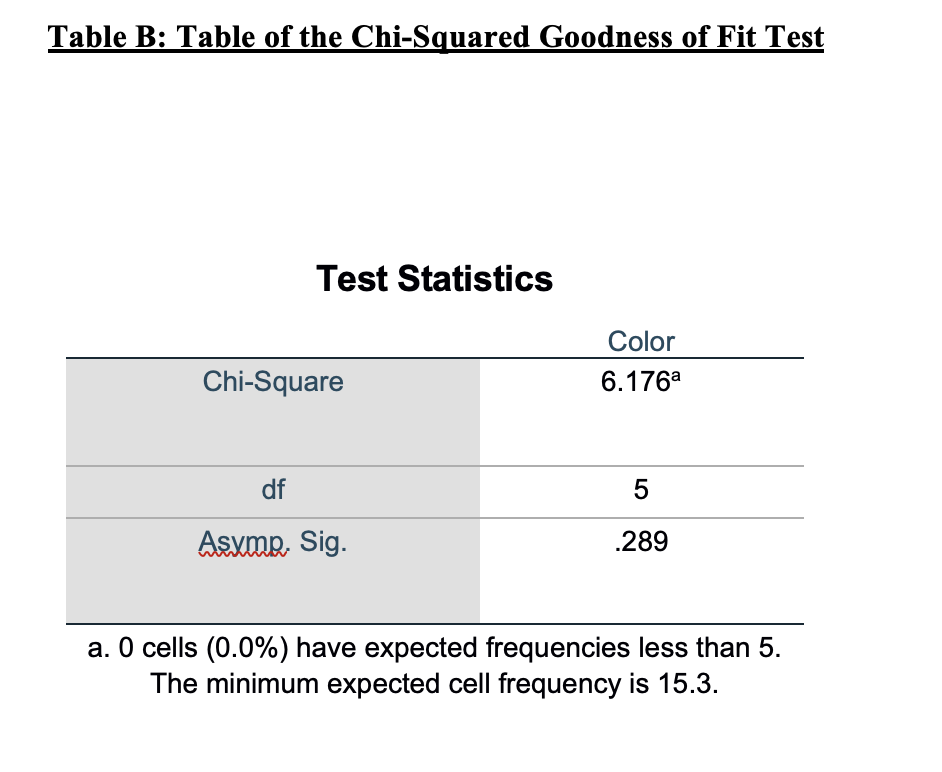
My claim is that the color breakdown for M&M's follows the advertised distribution. Since the p-value is .289 and the significance level is 0.01, we
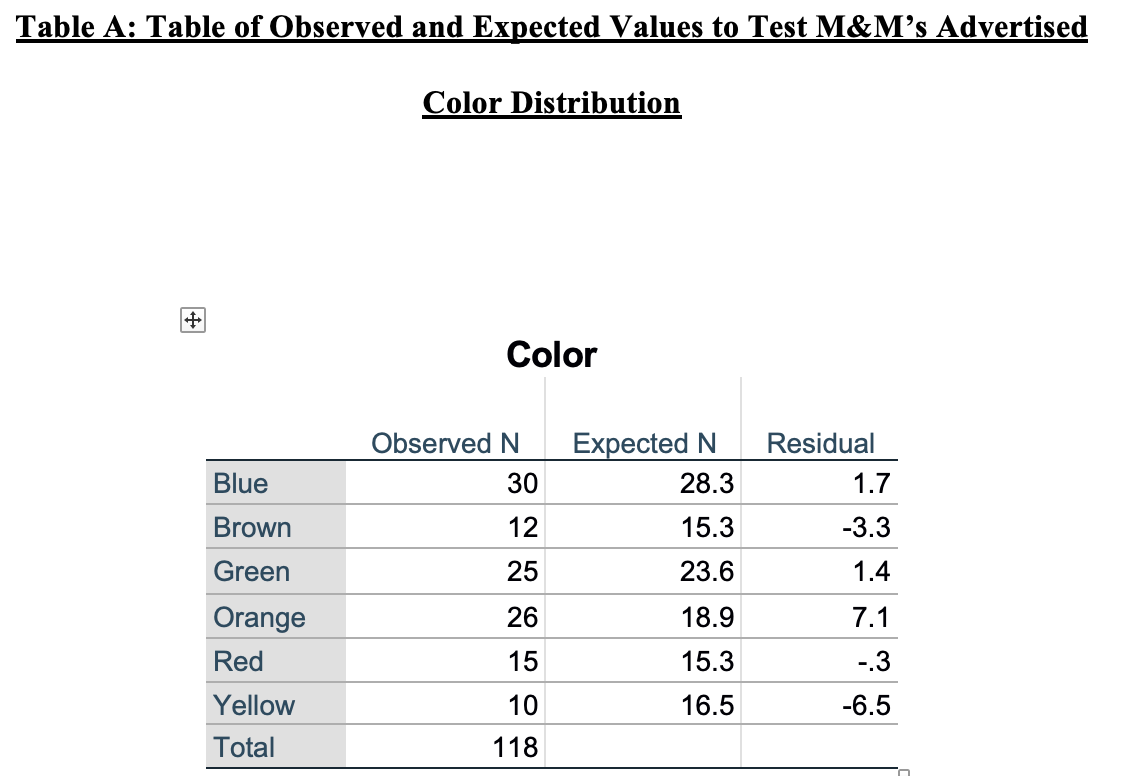
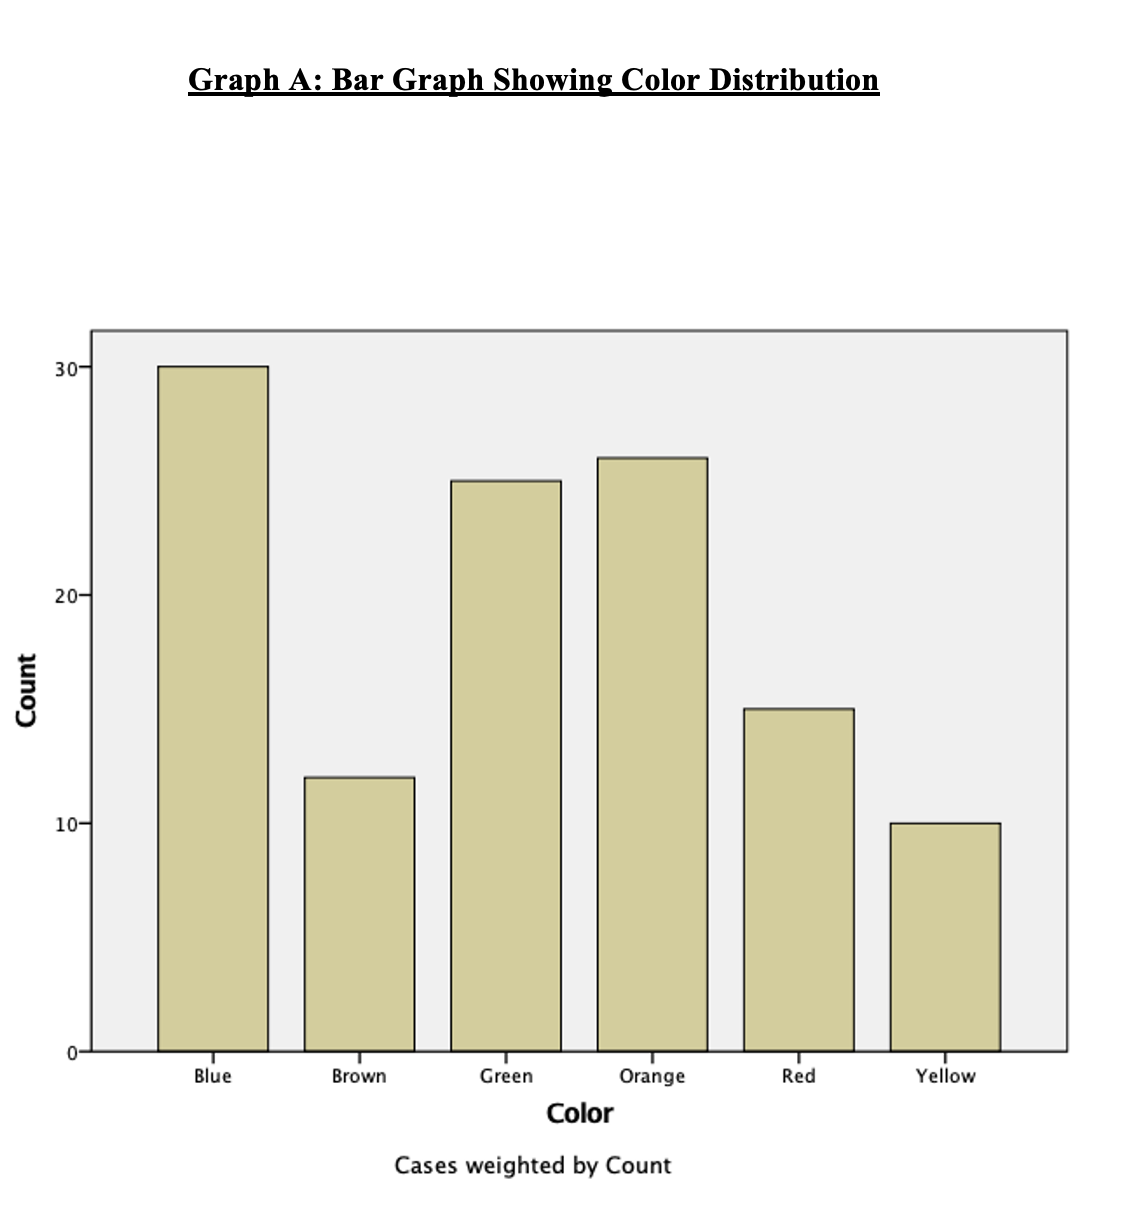
My claim is that the color breakdown for M&M's follows the advertised distribution. Since the p-value is .289 and the significance level is 0.01, we can conclude that the null hypothesis is failed to reject, there is not sufficient evidence to warrant rejection of the claim that the color breakdown for M&M's follows the advertised distribution (Table B). A bar graph shows that the packet of M&M's had a higher frequency blue, green and orange M&Ms and the least amount of yellow and brown M&Ms (Graph A). It was reasonable for goodness of fit test in terms of the expected counts because we assuming that the color of M&M packet and all expected frequencies were at least 5.
Observed and Expected Values Color Distribution, Test statistics, and bar graph attached
Critical Thinking Question:
- Do you think selecting a bag of M&Ms is a representative sample of all M&Ms?Explain!
- Why do you think that the M&M company does not make an equal number of each color of M&Ms?


Step by Step Solution
There are 3 Steps involved in it
Step: 1

Get Instant Access to Expert-Tailored Solutions
See step-by-step solutions with expert insights and AI powered tools for academic success
Step: 2

Step: 3

Ace Your Homework with AI
Get the answers you need in no time with our AI-driven, step-by-step assistance
Get Started


